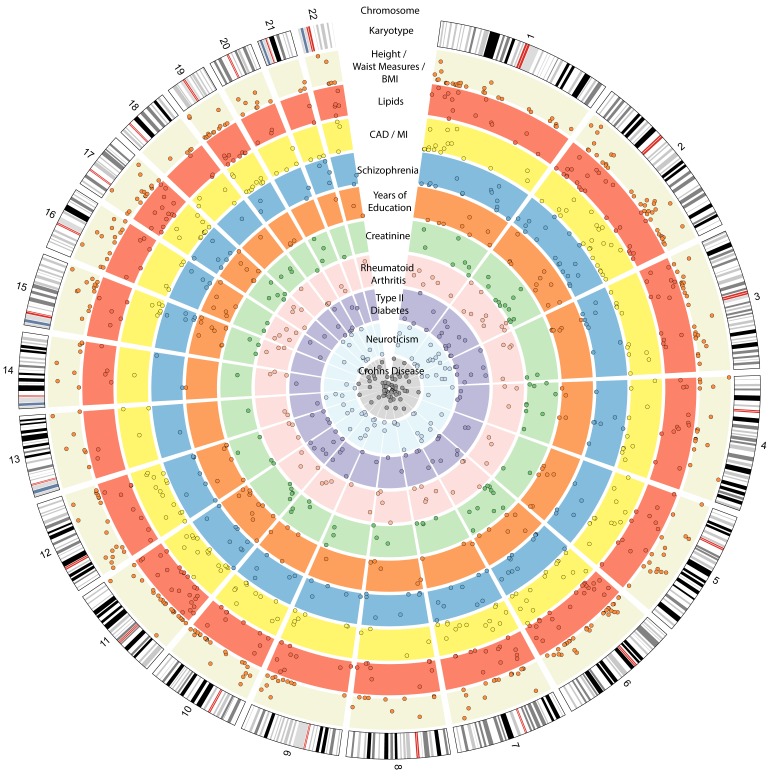
Figure 1.
Circos plot showing the 10 traits from the GWAS catalog (37) with the largest number of loci also associated to BP, as identified by PhenoScanner (38) at p < 0.05 (Supplemental Methods). The outer ring represents the genomic/chromosomal location (hg19). The following inner rings show the associations to different traits. Beige: body measurements (height, body mass index (BMI), weight, waist/hip ratio, hip circumference, waist circumference. N = 358). Red: lipids (high-density lipoprotein (HDL), low-density lipoprotein (LDL), triglycerides, total cholesterol. N = 226). Yellow: coronary artery disease (CAD)/myocardial infarction (MI) (N = 206). Blue: schizophrenia (N = 135). Orange: years of education attendance (N = 101). Light green: creatinine (N = 88). Light pink: rheumatoid arthritis (N = 78). Purple: type II diabetes (N = 73). Light turquoise: neuroticism (N = 69). Light grey: Crohn’s disease (N = 67).

