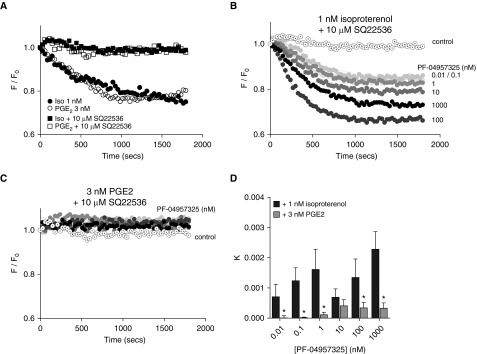
Figure 5.
Dose response of the selective PDE8 inhibitor PF-04957325 on isoproterenol- or prostaglandin E2 (PGE2)-stimulated cAMP dynamics in live HASM cells. (A) Representative cAMP difference detector in situ sensor fluorescence decay curves (F/F0) are shown for minimally effective concentrations of isoproterenol (1 nM) or PGE2 (3 nM) with and without 10 μM SQ22536 to suppress basal adenylyl cyclase activity. Various concentrations of PF-04957325 were then added to these same conditions. Representative decay curves are shown in the presence of 10 μM SQ22536 plus either (B) 1 nM isoproterenol or (C) 3 nM PGE2. PF-04957325 was tested at concentrations from 10−11 M (lightest circle) to 10−6 M (black circle). (D) Kinetic rate constants (k) from one-phase decay analysis (with a shared constrained plateau) were calculated for each dose of PF-04957325, and the pooled data from multiple experiments is shown. Each bar represents the mean ± SEM (n = 5 experiments). *P < 0.05 by paired t test as compared with isoproterenol.

