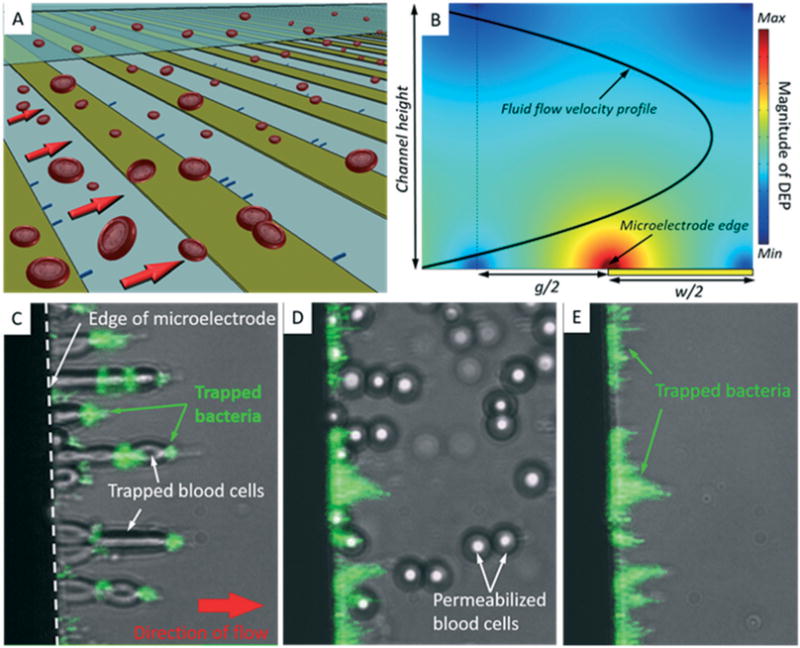
Fig. 3.

Continuous-mode dielectrophoretic separation of bacteria from blood cells. (A) Illustration of the flow-through DEP separation microchamber. Co-planar and parallel microelectrodes embedded within a microfluidic channel create the DEP force field to collect target bacteria and repel permeabilized BCs, which are swept to waste by fluid flow. (B) The DEP force field strength was simulated within a cross-sectional view of the microfluidic DEP device. The calculations reveal the location of the DEP trapping region near the electrode edge. The parabolic fluid velocity profile is also shown (bold black curve). The DEP force is symmetric about the middle plane of the electrode gaps (broken line). (C)–(E) Microphotographs (20× magnification) of BCs and fluorescently labeled E. coli within the microfluidic DEP device. The direction of flow is left to right, and all images are composites between bright-field and fluorescence images taken of the same field of view. (C) BCs and bacteria co-collect in the electric high field region at the edge of the microelectrode using a DEP signal of 1 MHz and 15 Vpp. (D) Saponin caused blood cells to be released from electrodes. Some bacteria were temporarily released but redistribute along microelectrodes downstream. (E) E. coli remained trapped by DEP.
