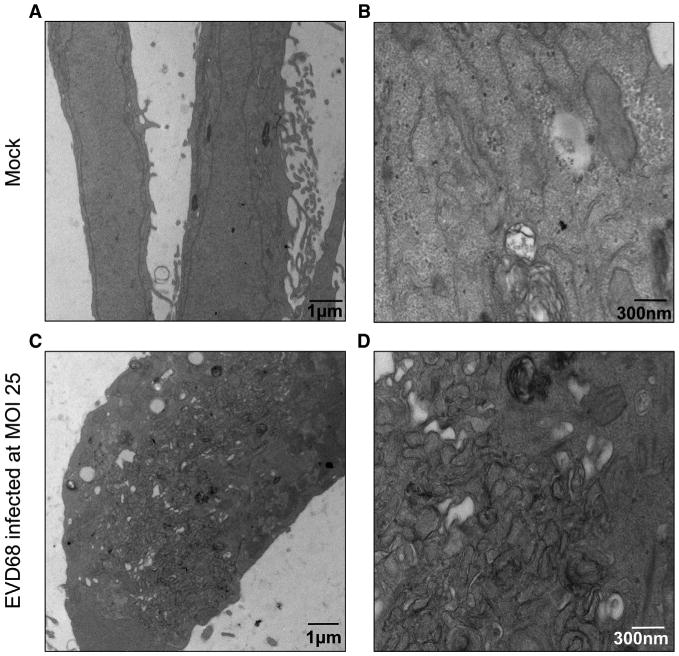
Figure 2. EV-D68 Changes Lipid Morphology upon Infection in H1HeLa Cells.

(A–D) H1HeLa cells were infected with EV-D68 at an MOI of 25 for 5 hr. Cells were collected, fixed, and subjected to transmission electron microscopy preparations and imaging. Mock (A and B) and EV-D68-infected (C and D) samples were imaged. Images shown are representative of the dataset.
