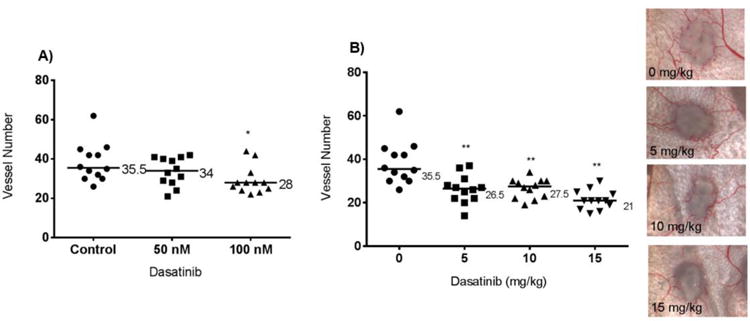
Figure 5.

Intradermal angiogenesis assay: nu/nu mice inoculated with 4T1 tumour cells. (A) 4T1 tumour cells were treated in vitro with 50 or 100 nM Dasatinib for 24 hours, then injected intradermally into the mice. (B) Mice were injected intradermally with 4T1 cells, then treated with Dasatinib for three days. Each point on the graph represents the number of vessels intersecting a single tumour nodule. Median values are shown. Wilcoxon matched pairs test was used to analyse data in GraphPad Prism 6.0. *p<0.05, **p<0.01. Representative images are shown.
