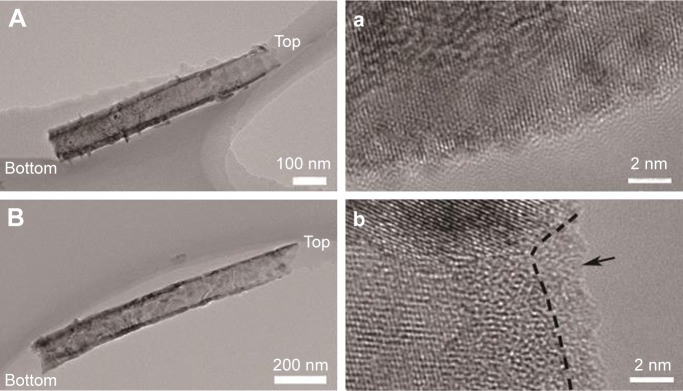
Figure 2.
TEM images of air-TNTs and H2-TNTs.
Notes: (A, a) air-TNTs and (B, b) H2-TNTs. A and B represent the cross section of samples; a and b represent the high resolution of transmission electron microscopy images of A and B. In (b), a short dashed curve is applied to outline a portion of the interface between the crystalline and the disordered outer layer (marked by black arrow).
Abbreviations: TEM, transmission electron microscopy; air-TNTs, air-annealed TiO2 nanotubes; H2-TNTs, hydrogenated TiO2 nanotubes.

