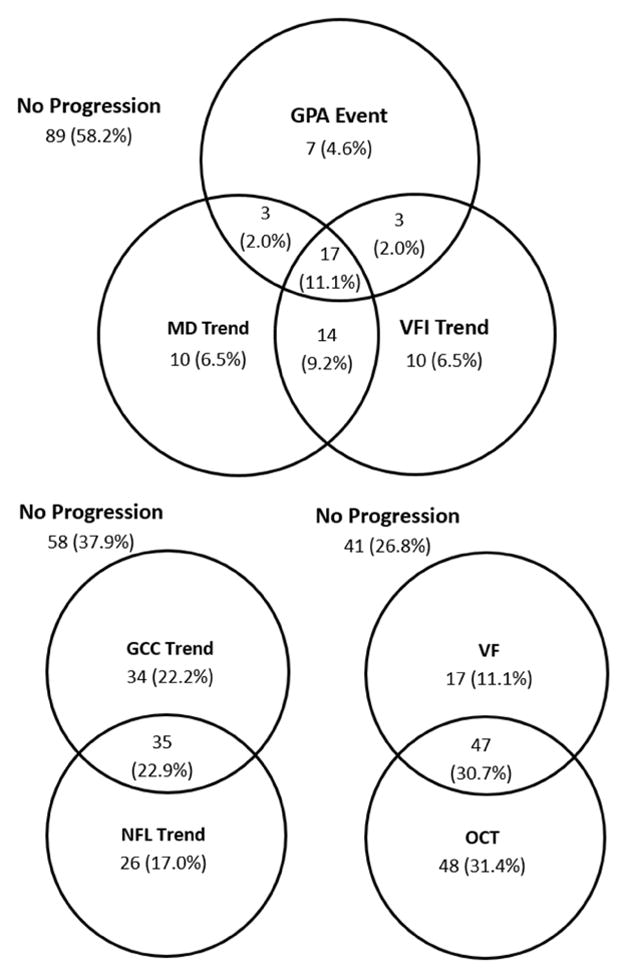
Figure 2.

Venn diagram of glaucoma progression detection in perimetric glaucoma eyes using various methods. The visual field (VF) methods include the visual field event analysis by Guided Progression Analysis (GPA) and the visual field trend analysis. The optical coherence tomography (OCT) methods include analysis of thinning trend in macular ganglion cell complex (GCC) and peripapillary retinal nerve fiber layer (NFL).
