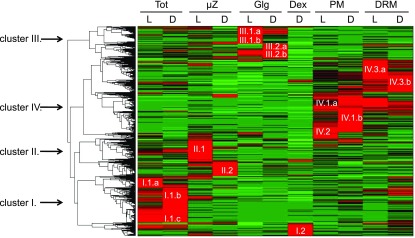
Figure 2.
Cluster Analysis of Cellular Fractions Reveals Four Distinct Clusters.
For hierarchical clustering, quantitative information based on Σ(Narea) per fraction was used. To ensure meaningful clustering, proteins with a Σ(Narea) <108 in all analyzed fractions were not included in the clustering analysis as they could constitute a source of noise due to the weakly associated quantitative data. Four main protein abundance clusters were identified corresponding to the purified subcellular fractions: Tot (cluster I), µZ (cluster II), Golgi vesicle (Glg; cluster III), PM (clusters IV.1 and IV.2), and DRM (clusters IV.3). In all fractions, each corresponding cluster was subdivided to take in account proteins that showed preferential accumulation in light- or dark-grown cells: TotL (I.1.a, I.1.c), TotD (I.1.b, I.1.c), µzL (II.1), µzD (II.2), GlgL (III.1, III.2.b), GlgD (III.2), Dex (I.2), PML (IV.1.a, IV.2), PMD (IV.1.b), DRML (IV.3.a), and DRMD (IV.3.b). Red indicates increased protein accumulation.

