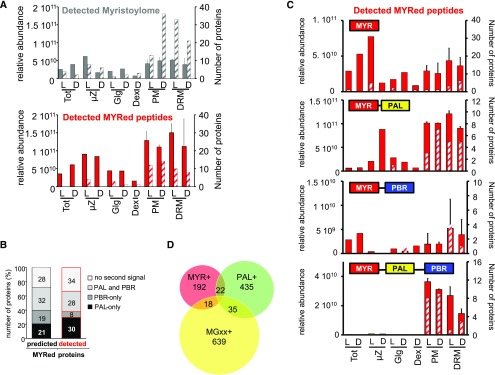
Figure 5.
Influence of PAL and PBR Secondary Targeting Signals on the Localization of Identified MYRed Proteins.
(A) The relative abundance of MS-identified MYRed proteins (i.e., with MYR detected or predicted) in different subcellular fractions was quantified based on ∑(Narea) (solid gray and red bars) or the number of proteins showing the maximum expression in a given fraction (gray and red hatched bars). Identified myristoylome is the pool of 231 MS-identified proteins for which the N-terminal MYRed peptide was directly detected (72 proteins) plus those predicted to undergo MYR (159 proteins; see Figure 3). Detected MYRed peptides belong to the set of 72 for which MYRed peptide was directly detected alone (red bars).
(B) Percentage of identified MYRed proteins containing a second targeting signal (PBR, PAL, both PAL and PBR, or no second signal).
(C) Relative abundance of identified MYRed proteins either containing or not containing a second targeting signal in the analyzed cellular fractions as in (A).
(D) Venn diagram representing the overlap between the identified protein sets: proteins identified and predicted as MYRed (232 proteins, MYR+), proteins experimentally determined as PAL by affinity purification (Hemsley et al., 2013) (492 proteins, PAL+), and identified proteins nonpredicted to be MYRed but carrying a Gly2 (692 proteins, MGxx+).

