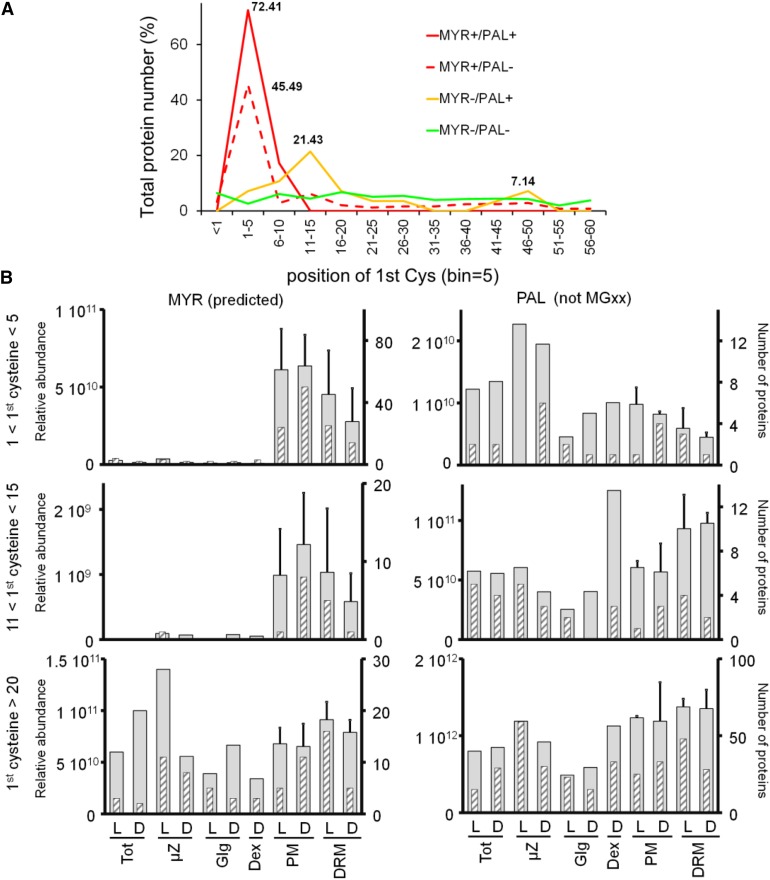
Figure 6.
Frequency Distribution of the First N-Terminal Cys Position in Relation to Subcellular Localization.
(A) Frequency distribution of the first Cys position is shown for the following subsets of identified proteins: MYRed (observed and predicted) and PALed (MYR+/PAL+, red line), MYRed but not PALed (MYR+/PAL-, dashed red line), not predicted to be MYRed but carrying a Gly2 (MGxx set) and PALed (MYR-/PAL+, yellow line), not predicted to be MYRed but carrying a Gly2 and not PALed (MYR-/PAL-, green line). Percentages for peaks of frequency distributions are indicated.
(B) Protein subcellular localization based on relative abundance expressed as ∑(Narea) (gray large bars) or based on the number of proteins showing the maximum expression in a given fraction (gray hatched thin bars) were plotted for MYRed predicted or PALed-only identified subsets as a function of the position of the first Cys in the protein sequence.

