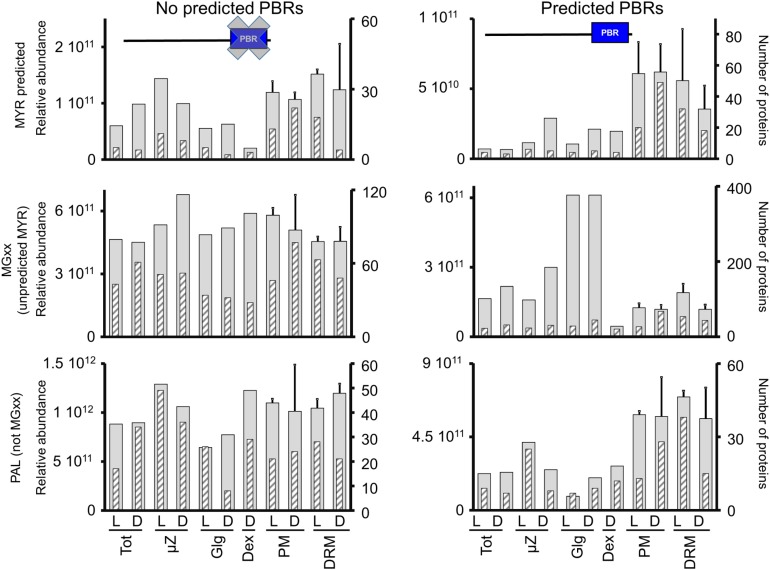
Figure 7.
Influence of Predicted PBRs on Protein Subcellular Localization.
Protein subcellular localization, taking in account the presence or absence of predicted PBRs, was plotted based on relative abundance expressed as ∑(Narea) (gray, large bars) or based on the number of proteins identified with maximal accumulation in a given fraction (gray hatched thin bars) for MYRed-predicted proteins, MYRed not predicted but carrying a Gly2, and for experimentally determined PALed proteins not carrying a Gly2 (PAL+/MGxx-).

