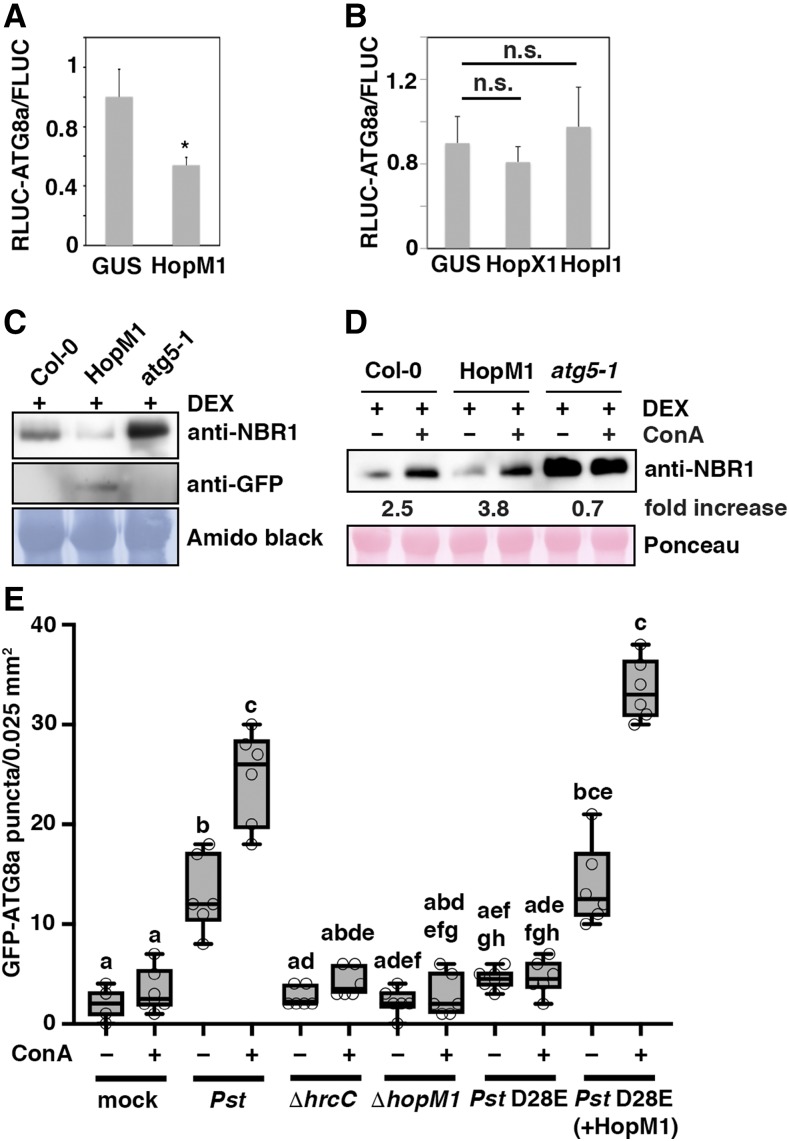
Figure 4.
Induction of Autophagy Is Dependent on the Delivery of the T3E HopM1.
(A) and (B) T3E-mediated influence on autophagic flux determined by the quantitative dual-luciferase assay. RLUC-ATG8a and FLUC constructs were coexpressed with HopM1 (A) or HopX1 and HopI1 (B) in N. benthamiana leaves in comparison to the GUS control, and Renilla and Firefly luciferase activities were simultaneously measured in leaf extracts at 48 h postinfiltration using the dual-luciferase system. Values represent the mean ratio of RLUC-ATG8a and FLUC activities and error bars show sd (n = 3). The significantly decreased ratio (*P < 0.05, Student’s t test) in the presence of HopM1 indicates increased autophagic flux due to enhanced turnover of vacuole-targeted RLUC-ATG8a protein. n.s., not significant.
(C) Immunoblot analysis of NBR1 protein levels in Col-0, transgenic DEX:HopM1-GFP, and atg5-1 seedlings upon treatment with dexamethasone (DEX; 30 μM) using an anti-NBR1 antibody. Induced expression of HopM1-GFP was validated with an anti-GFP antibody. The experiment was repeated twice with similar results.
(D) Immunoblot analysis of NBR1 protein levels in Col-0, transgenic DEX:HopM1-GFP, and atg5-1 seedlings upon treatment with DEX (30 μM) in combination with either DMSO (–) or ConA (+) for 14 h. Numbers correspond to the fold increase of NBR1 in ConA-treated samples in comparison to the respective DMSO control. Ponceau staining was used as loading control and for normalization of NBR1 signal intensities. The experiment was repeated three times with similar results.
(E) GFP-ATG8a-labeled autophagosomal structures were quantified from plants infected with the indicated bacterial strains 6 hpi in the presence or absence of ConA. Puncta were calculated in single planes of independent areas (n = 6 per condition) using ImageJ. Center lines show the medians; box limits indicate the 25th and 75th percentiles as determined by R software; whiskers extend 1.5 times the interquartile range from the 25th and 75th percentiles and data points are plotted as open circles. Different letters indicate statistically significant differences (P < 0.05) as determined by one-way ANOVA. The experiment was repeated twice with similar results.

