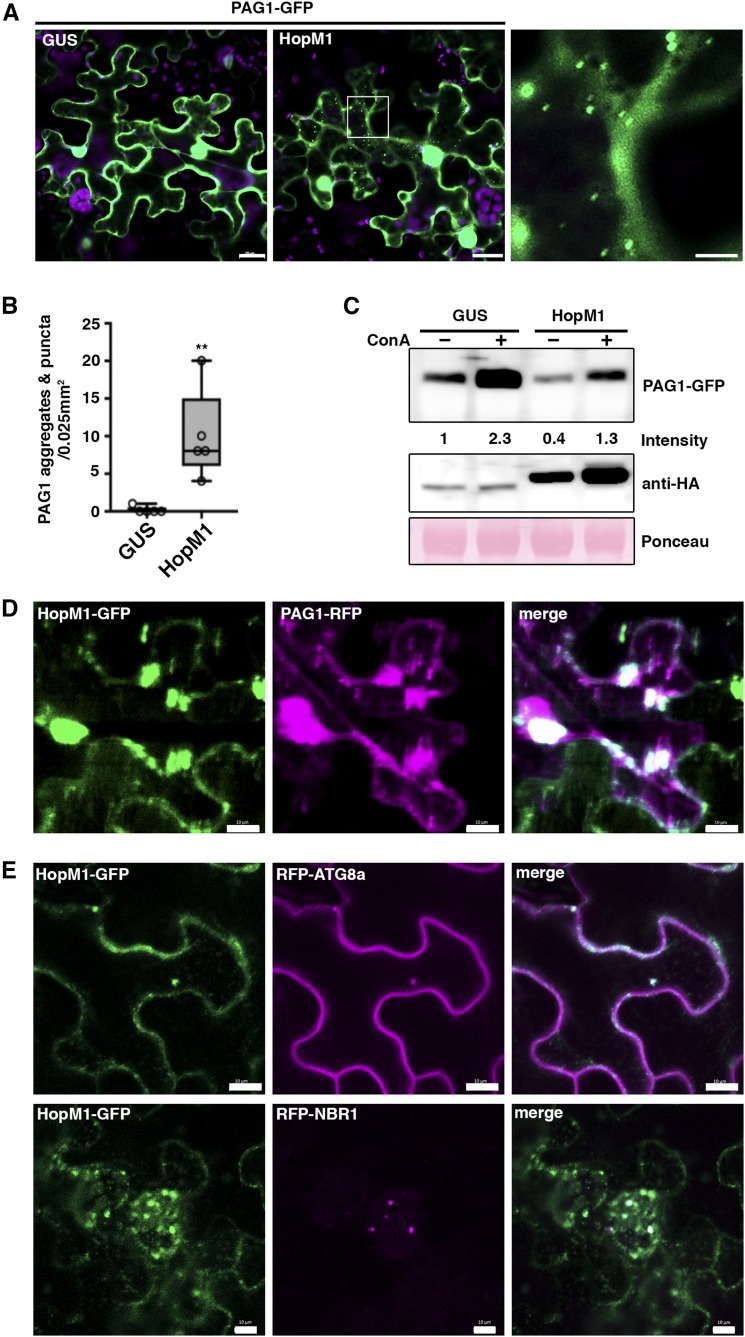
Figure 6.
HopM1 Induces Proteaphagy.
(A) Coexpression of PAG1-GFP with GUS or HopM1 in N. benthamiana leaves. Images were taken 2 d postinfiltration (bars = 20 μm). The right image shows a magnification of the boxed area (bar = 5 μm). The experiment was repeated three times with similar results.
(B) Quantification of PAG1-GFP aggregates in N. benthamiana leaves coexpressing PAG1-GFP with GUS or HopM1. The number of aggregates were calculated from single planes of independent leaf areas of 0.025 mm2 (n = 5) using ImageJ. Center lines show the medians; box limits indicate the 25th and 75th percentiles as determined by R software; whiskers extend 1.5 times the interquartile range from the 25th and 75th percentiles and data points are plotted as open circles. Asterisks indicate statistical significance (**P < 0.01) determined by Student’s t test in comparison with the control.
(C) Immunoblot analysis of PAG1-GFP upon transient expression of HA-tagged HopM1 and the GUS control in the presence (+) or absence (–) of ConA. The constructs were transiently expressed in N. benthamiana leaves for 48 h and samples were taken after treatment with DMSO or ConA for an additional 6 h. Extracted proteins were probed with anti-GFP and anti-HA antibodies, and numbers correspond to the relative PAG1-GFP signal intensities compared with the GUS control (–ConA). Ponceau S staining of RbcL was used as loading control and quantified for normalization of PBA1 signals. The analysis was repeated twice with similar results.
(D) Colocalization analysis of PAG1-RFP with HopM1-GFP in N. benthamiana leaves. Imaging was performed 2 d after transient expression and images represent single confocal planes from abaxial epidermal cells (bars = 20 μm). The experiment was repeated twice with similar results.
(E) Colocalization analysis of HopM1-GFP with RFP-ATG8a and RFP-NBR1 in N. benthamiana leaves. Imaging was performed 2 d after transient expression (bars = 10 μm) and the experiment was repeated twice with similar results.

