Figure 7.
NBR1 Counteracts P. syringae Infection.
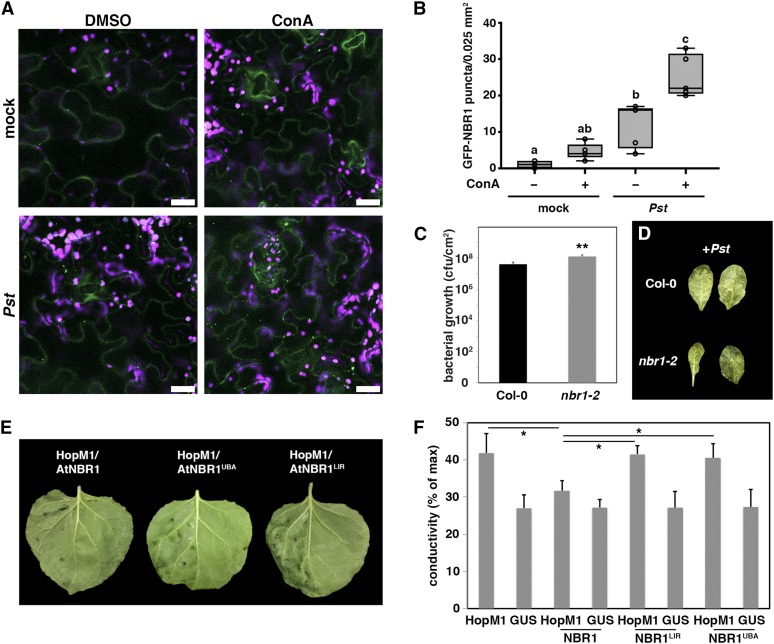
(A) Detection of GFP-NBR1 labeled structures in transgenic Col-0 plants upon mock and Pst infection in the presence (ConA) and absence (DMSO) of ConA. Images represent single confocal planes from abaxial epidermal cells and were taken at 8 hpi with identical microscope settings (bars = 20 μm). This experiment was repeated three times with similar results.
(B) GFP-NBR1 puncta were quantified in single planes of independent areas (n = 6) using ImageJ. Center lines show the medians; box limits indicate the 25th and 75th percentiles as determined by R software; whiskers extend 1.5 times the interquartile range from the 25th and 75th percentiles and data points are plotted as open circles. Different letters indicate statistically significant differences (P < 0.05) as determined by one-way ANOVA.
(C) Bacterial growth in leaves of Col-0 and nbr1-2 plants infected with Pst. Leaves were syringe infiltrated with a bacterial suspension at OD600 = 0.0001, and bacterial multiplication was determined at 3 dpi. Bars represent means ± sd (n = 4). Asterisks indicate statistical significance determined by Student’s t test (**P < 0.01) in comparison to Col-0. This experiment was repeated three times with similar results.
(D) Phenotypes of Pst-infected leaves of Col-0 and nbr1-2 at 3 dpi.
(E) Phenotype of N. benthamiana leaves expressing HopM1 together with Arabidopsis NBR1 wild-type (AtNBR1) or NBR1 variants mutated in the ATG8/LC3-interacting motif (AIM/LIR) and main ubiquitin binding (UBA2) domain (AtNBR1LIR and AtNBR1UBA) at 2 dpi. Only the left part of the leaves was infiltrated with agrobacteria expressing the respective constructs. The experiment was repeated at least three times with similar results.
(F) Quantification of HopM1-triggered water-soaking by ion leakage measurements. The indicated constructs were transiently expressed in N. benthamiana and samples were taken at 48 hpi. Bars represent the means ± sd calculated from four leaf discs per treatment with four replicates within an experiment. Asterisks indicate significant differences (*P < 0.05) based on Student’s t test.

