Figure 2.
Genetic Characterization and Expression Analysis Reveal Increased Dosage of TB-D1 in hb NILs.
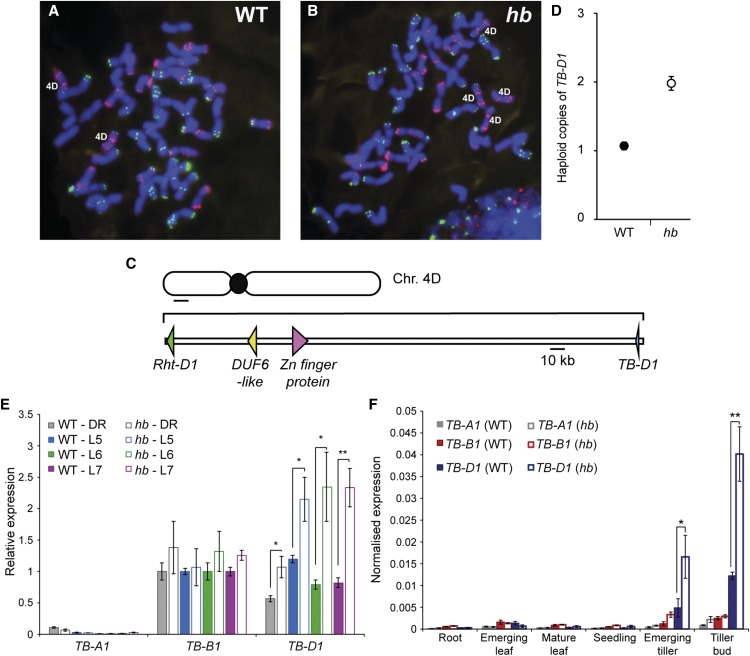
(A) and (B) FISH analysis of wild-type (A) and hb (B) lines; copies of chromosome 4D are labeled.
(C) Schematic diagram of chromosome 4DS region in proximity to Rht-D1. Gene identities: DUF6-like gene, TRIAE_CS42_4DS_TGACv1_362748_AA1181880; Zn-finger protein, TRIAE_CS42_4DS_TGACv1_363130_AA1183390.
(D) ddPCR analysis of haploid gene copy number for TB-D1 in wild-type (black) and hb (white) lines.
(E) Relative expression of TB-A1, TB-B1, and TB-D1 in developing inflorescences of wild-type (solid bars) and hb (white bars) plants, at double ridge (DR; gray), leaf 5 (L5; blue), leaf 6 (L6; green), and leaf 7 (L7; magenta) developmental stages. Expression is relative to TB-B1 in the wild type.
(F) Expression analysis of TB-A1 (gray), TB-B1 (red), and TB-D1 (purple) in vegetative tissues of wild-type (solid bars) and hb (white bars) plants. Data of ddPCR and expression analyses are mean ± se of three to four biological replicates. *P < 0.05 and **P < 0.01, compared with wild-type values.

