Figure 5.
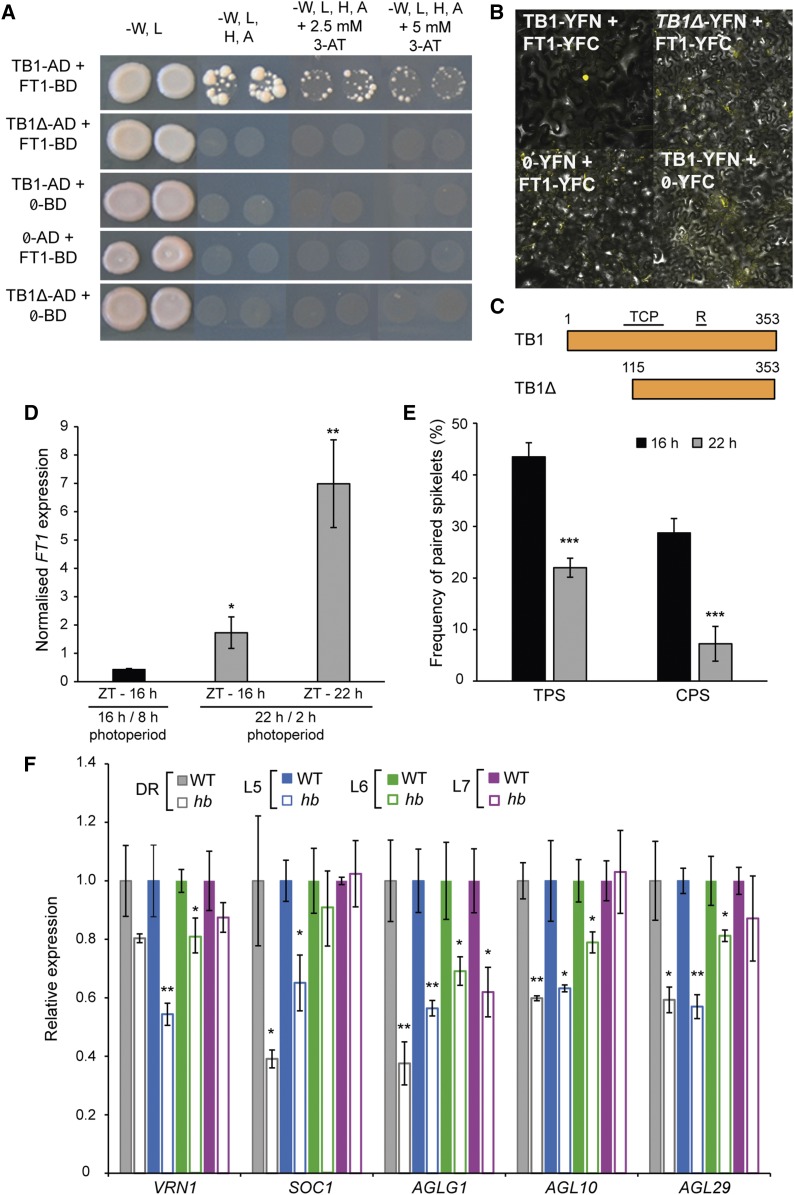
TB1 Interacts with FT1 and Modulates Expression of Meristem Identity Genes.
(A) Y2H assay between TB1 and FT1, including control reactions with truncated TB-D1 (TB1Δ) and empty vectors (Ø), grown on varying selective media.
(B) BiFC assay for TB1 and FT1, and control reactions including truncated TB-D1 (TB1Δ) and empty vectors (Ø).
(C) Schematic of full-length TB1 and truncated TB1 (TB1Δ) proteins used for Y2H and BiFC assays; TCP and R refer to domains of TB1 protein, and numbers indicate amino acid positions.
(D) and (E) Expression analysis of FT1 at dusk (D) and frequency of total paired spikelets (TPS) and complete fertile paired spikelets (CPS) in hb plants under standard LD photoperiods (black) and extended LD photoperiods (gray) (E).
(F) Expression of meristem identity genes in developing inflorescences of hb (white bars), relative to the wild type (solid bars), at double ridge (DR; gray), leaf 5 (L5; blue), leaf 6 (L6; green), and leaf 7 (L7; magenta) developmental stages. Data are mean ± se; n = 4 biological replicates for (D) and (F) and n = 10 biological replicates for (E). *P < 0.05, **P < 0.01, and ***P < 0.001, compared with standard LD values ([D] and [E]) and wild-type values (F).

