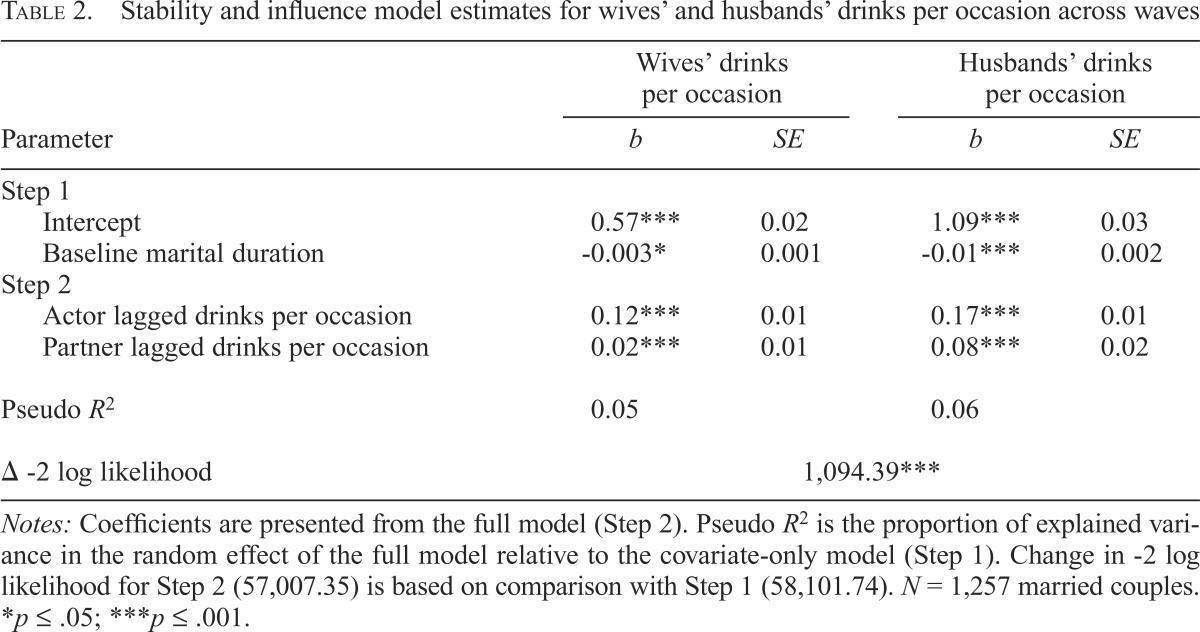
Table 2.
Stability and influence model estimates for wives’ and husbands’ drinks per occasion across waves
| Parameter | Wives’ drinks per occasion |
Husbands’ drinks per occasion |
||
| b | SE | b | SE | |
| Step 1 | ||||
| Intercept | 0.57*** | 0.02 | 1.09*** | 0.03 |
| Baseline marital duration | -0.003* | 0.001 | -0.01*** | 0.002 |
| Step 2 | ||||
| Actor lagged drinks per occasion | 0.12*** | 0.01 | 0.17*** | 0.01 |
| Partner lagged drinks per occasion | 0.02*** | 0.01 | 0.08*** | 0.02 |
| Pseudo R2 | 0.05 | 0.06 | ||
| Δ -2 log likelihood | 1,094.39*** | |||
Notes: Coefficients are presented from the full model (Step 2). Pseudo R2 is the proportion of explained variance in the random effect of the full model relative to the covariate-only model (Step 1). Change in -2 log likelihood for Step 2 (57,007.35) is based on comparison with Step 1 (58,101.74). N = 1,257 married couples.
p ≤ .05;
p ≤ .001.

