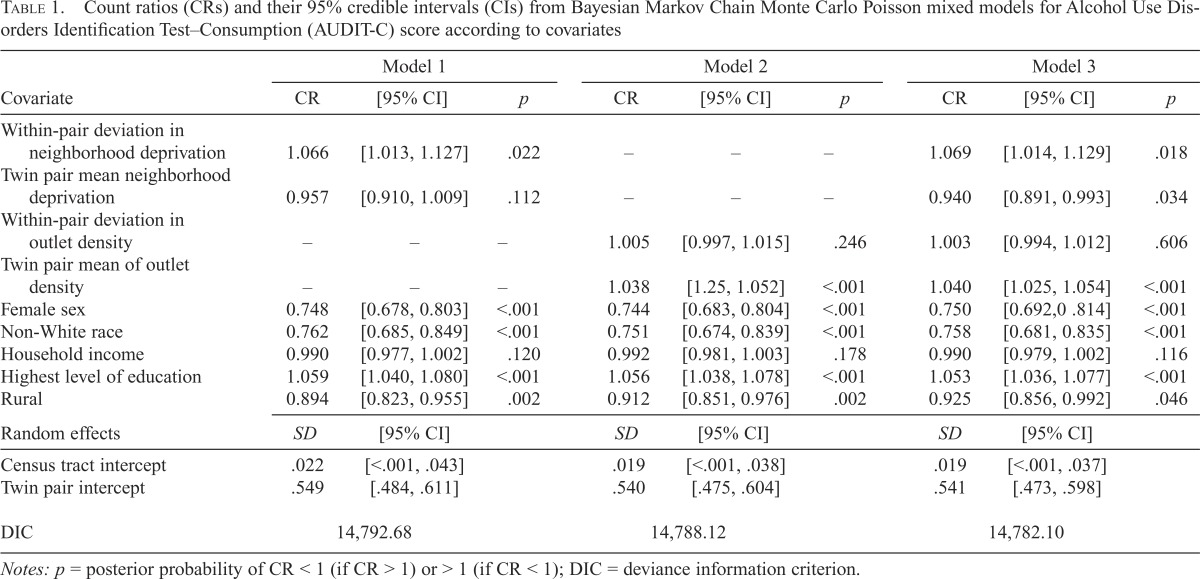
Table 1.
Count ratios (CRs) and their 95% credible intervals (CIs) from Bayesian Markov Chain Monte Carlo Poisson mixed models for Alcohol Use Disorders Identification Test–Consumption (AUDIT-C) score according to covariates
| Covariate | Model 1 | Model 2 | Model 3 | ||||||
| CR | [95% CI] | p | CR | [95% CI] | P | CR | [95% CI] | p | |
| Within-pair deviation in neighborhood deprivation | 1.066 | [1.013, 1.127] | .022 | – | – | – | 1.069 | [1.014, 1.129] | .018 |
| Twin pair mean neighborhood deprivation | 0.957 | [0.910, 1.009] | .112 | – | – | – | 0.940 | [0.891, 0.993] | .034 |
| Within-pair deviation in outlet density Twin pair mean of outlet | – | – | – | 1.005 | [0.997, 1.015] | .246 | 1.003 | [0.994, 1.012] | .606 |
| Density | – | – | – | 1.038 | [1.25, 1.052] | <.001 | 1.040 | [1.025, 1.054] | <.001 |
| Female sex | 0.748 | [0.678, 0.803] | <.001 | 0.744 | [0.683, 0.804] | <.001 | 0.750 | [0.692,0 .814] | <.001 |
| Non-White race | 0.762 | [0.685, 0.849] | <.001 | 0.751 | [0.674, 0.839] | <.001 | 0.758 | [0.681, 0.835] | <.001 |
| Household income | 0.990 | [0.977, 1.002] | .120 | 0.992 | [0.981, 1.003] | .178 | 0.990 | [0.979, 1.002] | .116 |
| Highest level of education | 1.059 | [1.040, 1.080] | <.001 | 1.056 | [1.038, 1.078] | <.001 | 1.053 | [1.036, 1.077] | <.001 |
| Rural | 0.894 | [0.823, 0.955] | .002 | 0.912 | [0.851, 0.976] | .002 | 0.925 | [0.856, 0.992] | .046 |
| Random effects | SD | [95% CI] | SD | [95% CI] | SD | [95% CI] | |||
| Census tract intercept | .022 | [<.001, .043] | .019 | [<.001, .038] | .019 | [<.001, .037] | |||
| Twin pair intercept | .549 | [.484, .611] | .540 | [.475, .604] | .541 | [.473, .598] | |||
| DIC | 14,792.68 | 14,788.12 | 14,782.10 | ||||||
Notes: p = posterior probability of CR < 1 (if CR > 1) or > 1 (if CR < 1); DIC = deviance information criterion.

