Figure 4.
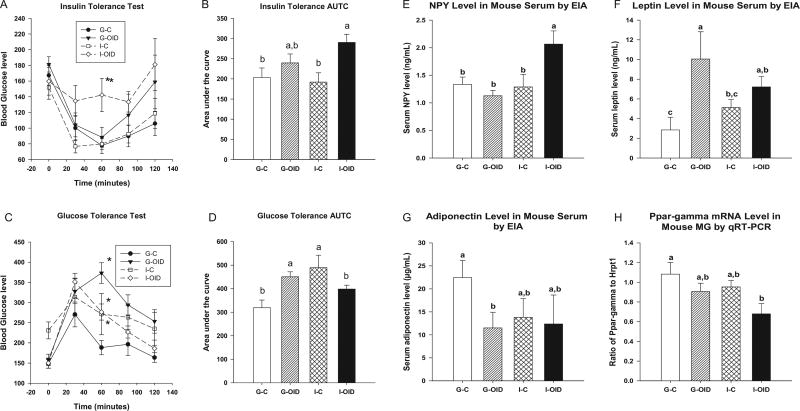
Effect of OID and social isolation on insulin and glucose tolerance, and on neuropeptide Y, PPARγ and adipokine levels. Insulin and glucose tolerance were studied in 12- to 14-week-old mice exposed to MPA + DMBA that were group-housed and fed control diet (G-C), group-housed and fed obesity-inducing diet (G-OID), socially isolated and fed control diet (I-C) and socially isolated and fed OID (I-OID) (n = 4–10 mice per group). Blood glucose levels were determined at baseline (0 min, before injection) and 30, 60, 90 and 120 min after injection. (A) Insulin tolerance: at 60 min, glucose levels were significantly higher in I-OID mice than the G-C mice: P = 0.015 (difference marked with *). (B) Area under the curve (AUTC) in insulin tolerance test was significantly increased in socially isolated OID-fed mice: P = 0.021. (C) Glucose tolerance: At baseline, glucose levels were significantly elevated by social isolation but only in control diet-fed mice: P for interaction = 0.013. At 60 min, OID elevated glucose levels: P = 0.015. In addition, there was a significant interaction between OID and social interaction at 60 min: P = 0.021 (for interaction), 90 min: P = 0.016 (for interaction) and 120 min: P = 0.038 (for interaction), indicating that OID elevated glucose levels in group-housed mice and social isolation in control diet-fed mice (differences marked with *). (D) There was a significant interaction between OID and social isolation in affecting AUTC in glucose tolerance test (P = 0.033). At the end of tumor-monitoring period, serum and mammary tissues were obtained and EIA and qRT-PCR were performed to determine the circulating levels of neuropeptide Y (NPY), leptin and adiponectin and mRNA expression of Pparγ in the mammary glands (n = 4–7 mice per group). (E) NPY levels were significantly elevated in I-OID group; interaction: P = 0.013. (F) Leptin levels were significantly elevated in OID-fed mice: P < 0.001, and (G) adiponectin levels were significantly reduced in OID-fed mice: P = 0.011 and socially isolated mice: P = 0.042, but post hoc analysis indicated that the difference was significant only between G-OID and G-C groups. (H) Pparγ mRNA expression was significantly reduced by OID: P = 0.010 and social isolation: P = 0.036, but post hoc analysis indicated that the difference was significant only between I-OID and G-C groups. Bars marked with different letters are significantly different from each other. Means and standard error of means (s.e.m.) are shown.

