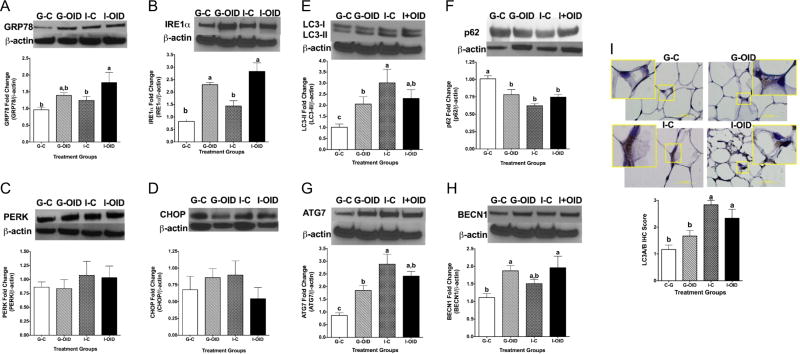
Figure 6.
Effect of OID and social isolation on unfolded protein response (UPR), determined by immunoblotting UPR markers (A) GRP78; increased by OID: P = 0.016, but post hoc analysis indicated that only isolated mice fed OID had significantly higher expression of GRP78 than controls, (B) IRE1; increased by OID: P < 0.001 and social isolation: P = 0.012. (C) PERK; no significant changes, (D) CHOP; no significant changes. Effect of OID and social isolation on autophagy, determined by immunoblotting autophagy markers (H) Beclin1; increased by OID: P = 0.008, (G) Atg7; increased by social isolation: P < 0.0001. Although OID also increased Atg7 expression in group-housed mice, socially isolated mice fed control diet had higher expression than G-OID or I-OID: P for interaction = 0.002, (E) LC3II; increased by social isolation: P = 0.002. Although OID also increased LC3II expression in group-housed mice, socially isolated mice fed control diet had higher expression than G-OID or I-OID: P for interaction = 0.009, and (F) p62; downregulated by social isolation: P < 0.001. Although OID also reduced p62 expression in group-housed mice, socially isolated mice fed control diet had higher expression than G-OID or I-OID: P for interaction = 0.003. (I) LC3A/B puncta staining of mammary glands; increased by social isolation: P < 0.001. Bars marked with different letters are significantly different from each other. Means and standard error of means (s.e.m.) of 4–11 mice per group are shown; these mice were not exposed to DMBA.

