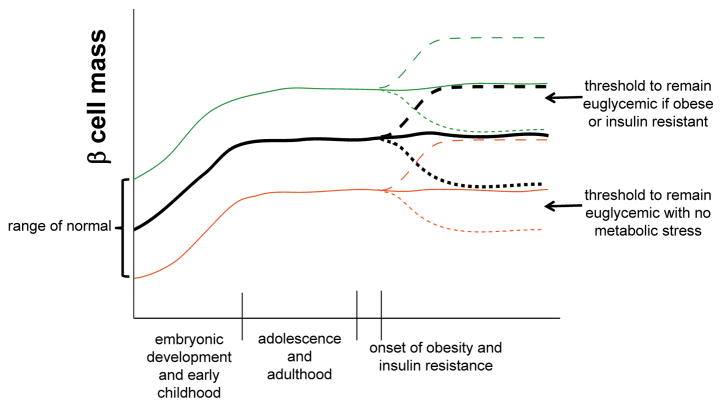
Figure 2. Dyamics of β-cell mass under normal and impaired metabolic states.
β-cell mass is established via neogenesis during embryogenesis and proliferation in early postnatal life, plateauing in childhood. Individuals are born with a range of β-cell mass that is considered “normal” in that it is sufficient to maintain euglycemia in the absence of metabolic stress. Average β-cell mass is shown in the black solid line, upper and lower ranges of normal are shown in green and orange solid lines, respectively. With the onset of obesity and insulin resistance, the normal response is an expansion in β-cell mass (by proliferation) shown in the dashed lines. Individuals starting with a lower level of β-cell mass may not reach the threshold required to maintain euglycemia in the setting of insulin resistance, leading to increased susceptibility for type 2 diabetes. Alternatively, β-cell failure and/or death (dotted lines) can occur in the setting of obesity and insulin resistance, again leading to an increased susceptibility to type 2 diabetes for individuals starting with fewer β-cells.

