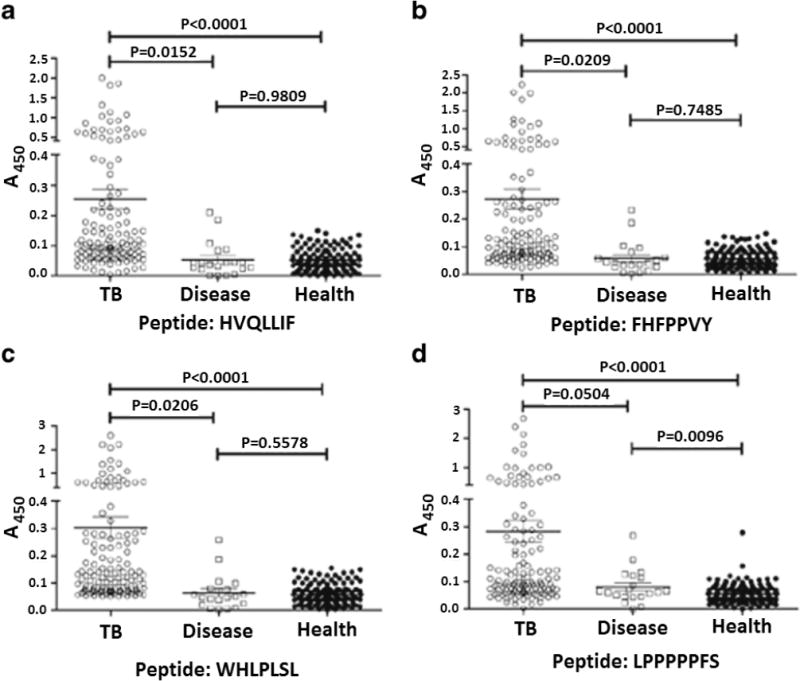
Figure 8.

Detection of tuberculosis from the sera of tuberculosis patients (n = 130), disease control (control group of nontuberculosis patients that had a respiratory infectious disease) (n = 20), and healthy individuals (n = 134). The mean optical density value for each triplicate sample was read 20 min after the addition of a substrate in an ELISA. The scatter plot represents the distribution of IgG levels with respect to the four potential binding peptides. Plates were coated with 4 μg of peptides per well.70 Adapted with permission from ref70. Copyright 2016 Springer.
