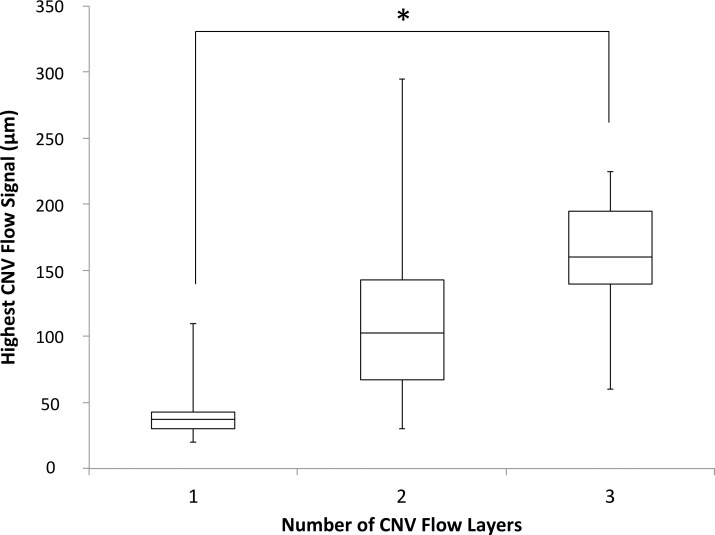
Figure 5.
Box plot of highest CNV flow signal for CNV with different numbers of CNV flow layers. CNV with three flow layers had significantly greater highest CNV flow compared with CNV with one CNV flow layer (Kruskal-Wallis H Test with post hoc Dunn test, P < 0.01). Asterisk represents statistical significance.

