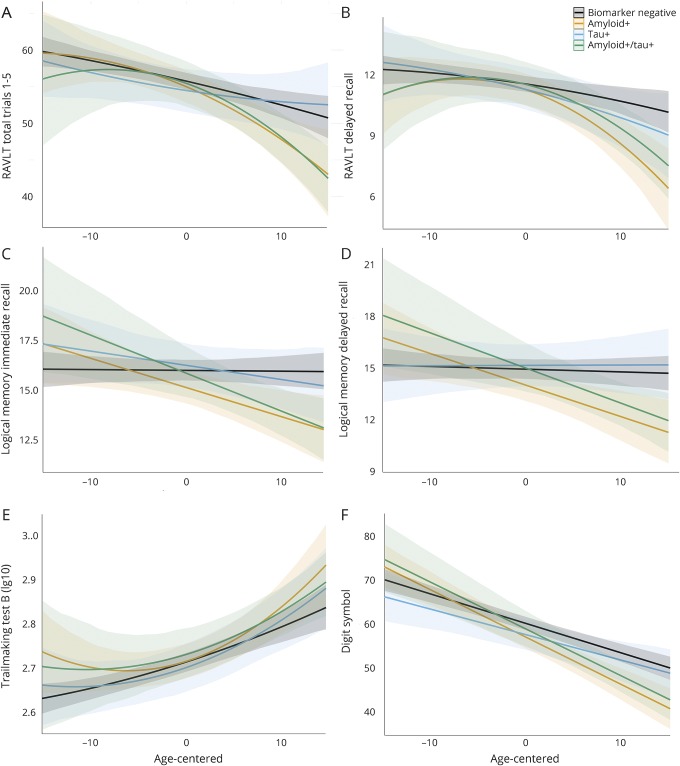
Figure 1. Biomarker groups and cognitive trajectories.
Graphs depict neuropsychological performance on the y-axis for 6 cognitive measures (A–F) and age at each visit (centered on mean age) on the x-axis. Each line depicts the estimated slope for the 4 biomarker groups, adjusting for covariates of sex, education, and practice effects. Higher scores equate better performance on all measures except TMT-B (higher scores = worse performance). Quadratic terms were retained for the RAVLT and TMT-B. Nonsignificant quadratic terms were removed for other outcomes, and linear effects are depicted. Both the Aβ+ only group (orange) and the Aβ+/tau+ group (green) exhibited significantly greater decline than the biomarker-negative group (black). In contrast, the group with only tau+ (blue) did not differ from biomarker-negative individuals. Aβ = β-amyloid; RAVLT = Rey Auditory Verbal Learning Test; TMT-B = Trail Making Test Part B.

