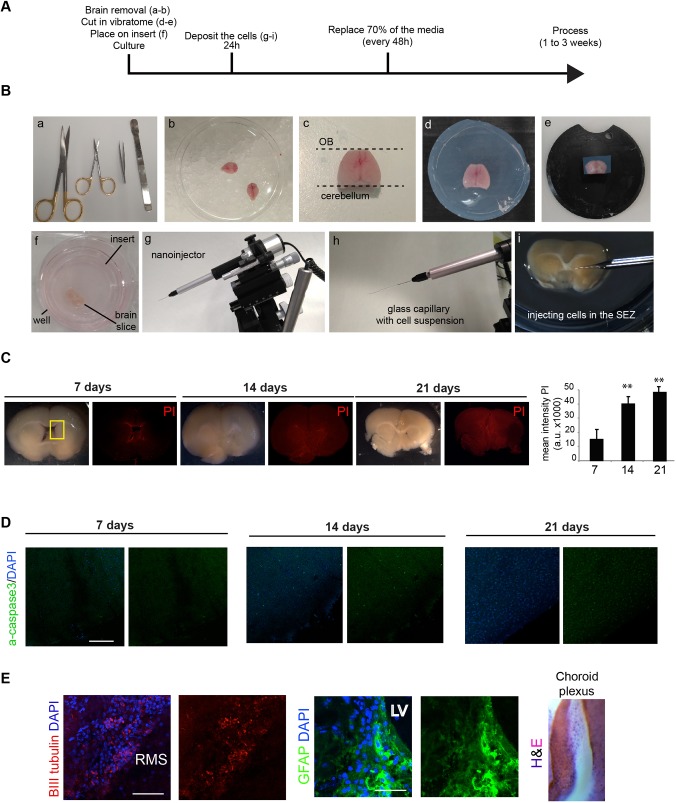
Fig. 1.
Overall experimental strategy and tissue processing. (A) Summary of the experimental procedure to generate slices. (B) Experimental steps in the harvesting, mounting, slicing and injection of brain tissue; (a) scissors, forceps and a spatula were used to isolate and dissect the whole brain; (b) whole adult mice brain on ice following harvesting; (c) dorsal image of a whole brain following removal of the olfactory bulb (OB) and cerebellum; (d) embedded brain in low melting agarose; (e) brain attached to the support of the vibratome; (f) ∼250 µm coronal brain slice placed onto a cell culture insert in a six-well plate with NSC basal medium; (g) nanoinjector mounted on a micromanipulator used for injection of small volumes of cells; (h) mounted glass capillary containing the cell suspension; (i) microinjection of cells into the SEZ of a coronal brain slice on the cell culture insert. (C,D) After 7, 14 and 21 days, tissue was stained for PI (C) and active caspase 3 (D). The boxed area in C shows the SEZ. Quantification of the mean intensity of PI in the brain slices up to 21 days (rightmost in C). (E) Immunocytochemistry following 7 days in slice co-culture for BIII tubulin neuroblasts (red, left), GFAP-positive gliotubes (green, middle), and choroid plexus (H&E, right). Nuclear counterstaining was performed with DAPI in each (blue). CC, corpus callosum; LV, lateral ventricle; RMS, rostral migratory stream; Sep, Septum; SEZ, subependymal zone. Scale bars: 200 μm in D; 100 µm (left) and 10 µm (right) in E. n=3, Student’s t-test, **P<0.01.

