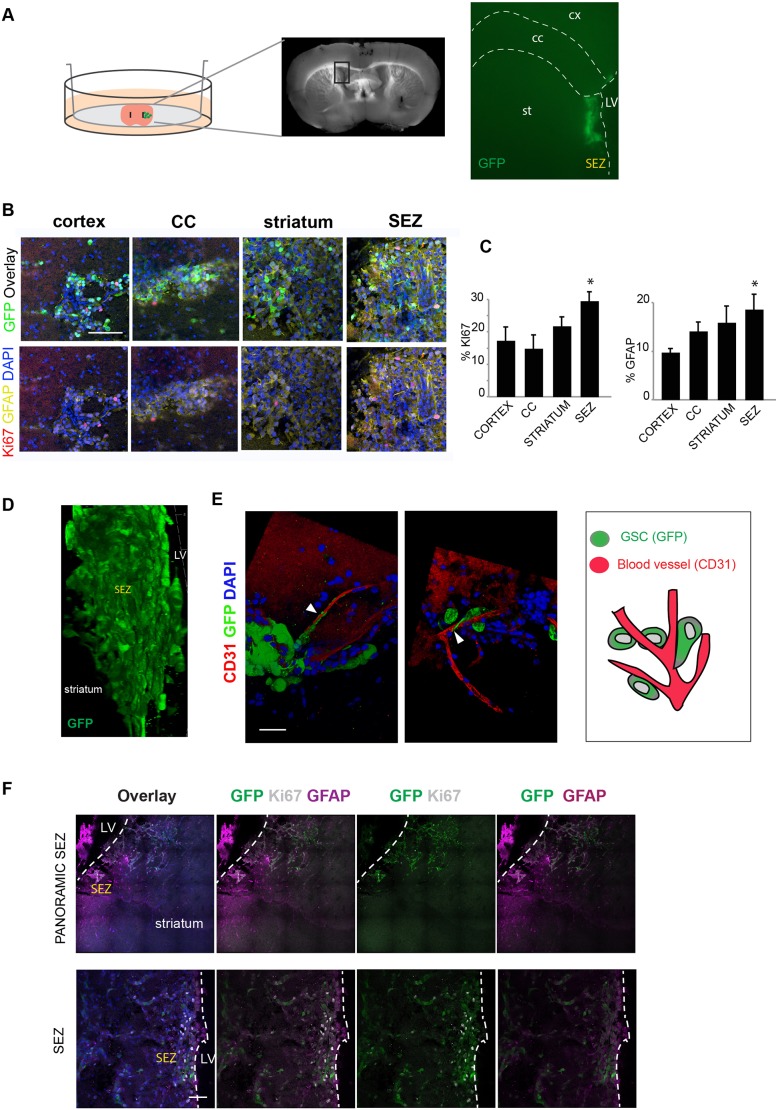
Fig. 4.
GSCs in their niche. (A) Schematic of the experimental setup: co-culture of GSCs and a whole brain coronal section. The boxed area in the section is shown enlarged on the right, indicating the panoramic position of the GSCs (GFP, green) in the SEZ after deposition. (B) Immunostaining for GFAP (yellow), Ki67 (red) and GFP (green) in the cells deposited in different parts of the brain slices. Nuclear counterstaining was performed with DAPI (blue). (C) Quantification of the percentage of proliferating and differentiating cells (Ki67 and GFAP, respectively). (D) 3D image showing the engraftment and infiltration of the IENS-GFP in the brain slice after 5 days. (E) 3D image with immunostaining of the IENS-GFP contacting the blood vessels: GFP (green), CD31 (red) and nuclear counterstaining with DAPI (blue). Arrowheads indicate contact of GSCs with blood vessels. Schematic of the interaction of GSCs with brain blood vessels (right). (F) Top: panoramic view of IENS-GFP cells in SEZ with immunostaining for GFP (green), Ki67 (white), GFAP (purple) and nuclear counterstaining with DAPI (blue). Bottom: detail from the images in the top row. Cells are proliferating and expressing GFP, the astrocytic marker GFAP and the proliferative marker Ki67. LV, lateral ventricle. Scale bars: 100 µm in B; 20 µm in E; 50 µm in F. n=3, Student’s t-test, *P<0.05.

