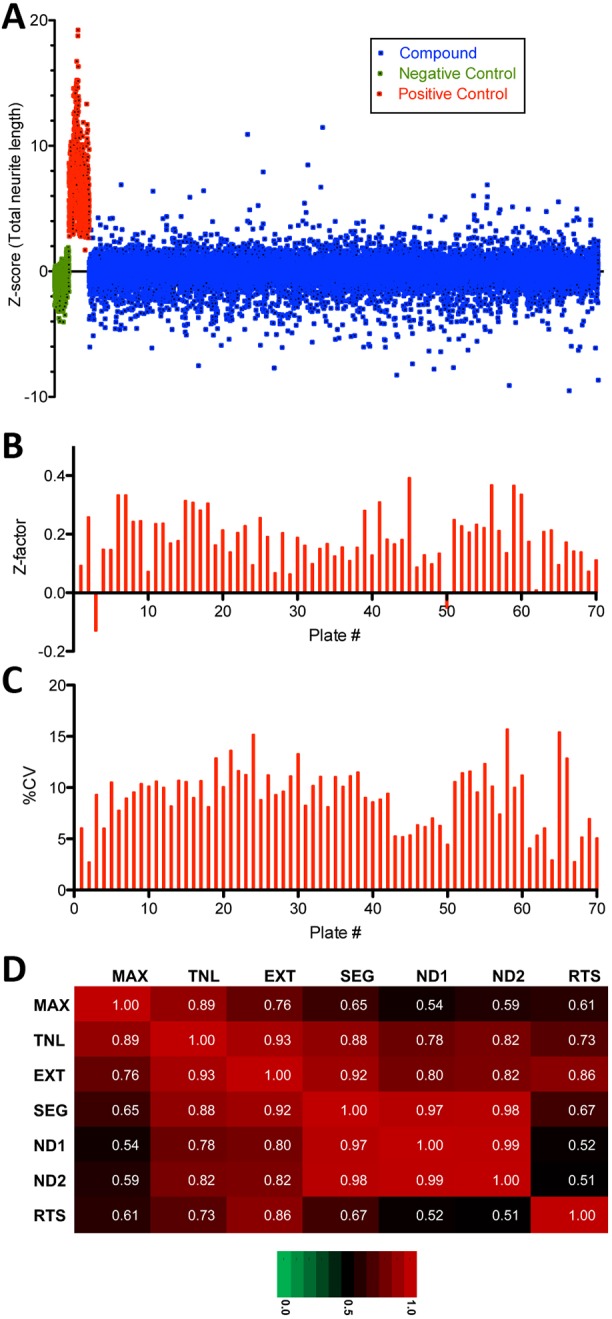
Fig. 2.

Primary screen results overview. (A) Scatter plot of primary screen data; 5215 compounds (blue) tested in duplicate at two concentrations (0.5 µM and 5.0 µM), for a total of 20,860 data points (blue, single replicates shown). Results were normalized to Z-scores based on DMSO-treated wells (green). Staurosporine at 0.2 µM (red) was used as a positive control. (B) Individual plate Z-factors for the primary screen range from −0.13 to 0.39 with an average of 0.19 (n=70), with only 2/70 plates exhibiting a Z-factor<0. (C) Coefficient of variation (CV) for screening plates ranges from 2.7% to 15.7%, with an average intraplate CV of 9.1% (n=70) and an interplate CV of 15.8%. (D) Coefficients of determination (r2) indicate that the seven measures of neurite morphology [MAX, maximum neurite length; TNL, total neurite length; EXT, number of extremities; SEG, number of neurite segments; ND1, number of nodes type 1 (intersection of segments); ND2, number of nodes type 2 (SEG divided by RTS); RTS, number of roots] are highly correlated, especially number of neurite segments (SEG) and both measures of number of nodes (ND1 and ND2) as they represent multiple readouts of neurite branching.
