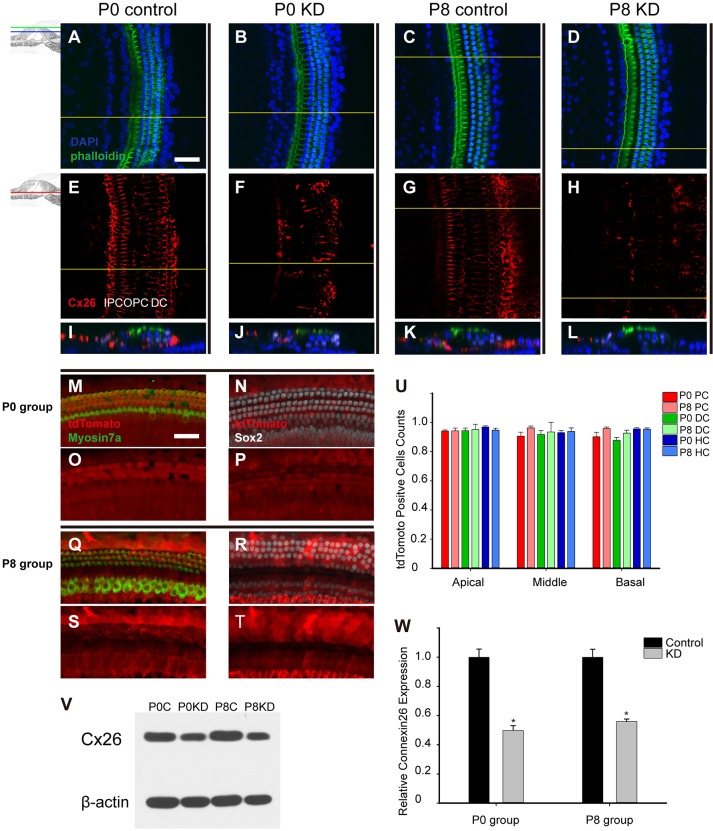
Fig. 1.
Cx26 KD in the cochlea and Cre-positive cell counts in timed conditional Cx26 KD mouse models. Summary of Cx26 expression in control and experimental groups. (A-D) The mice were sacrificed 18 days after TMX injection, and the pictures were captured at the apical turn (20–35% from the apex) from the P0 control group (A), the P0 KD group (B), the P8 control group (C) and the P8 KD group (D). (E-H) Immunolabeling of Cx26 (red) in the stretched preparation in the corresponding control and experimental groups. (I-L) Cross-sections were generated using confocal reconstruction from the corresponding control and experimental groups. The tdTomato signal was detected 5 days after TMX injection. (M,Q) The tdTomato staining (red), with hair cells labeled by Myosin7a (green) in the P0 (M) and P8 (Q) groups. (N,R) The tdTomato staining (red), with supporting cells labeled by Sox2 (white) in the P0 (N) and P8 (R) groups. (O,P,S,T) Single tdTomato signals are shown in the corresponding pictures. (U) The percentages of tdTomato-positive cells in the P0 and P8 groups (n=3 in each group). (V) Representative western blot results are shown for the P0 control, P0 KD, P8 control and P8 KD groups; β-actin was used as the control. (W) Relative Cx26 expression (n=4 in each group) in the control and experimental groups. The differences between the P0 KD group and the P8 KD group were not significant (P>0.05). *Significantly different from the control group (P<0.05). Scale bar: ∼50 µm (A,M). DC, Deiter's cells; HC, hair cells; PC, pillar cells.

