Fig. 3.
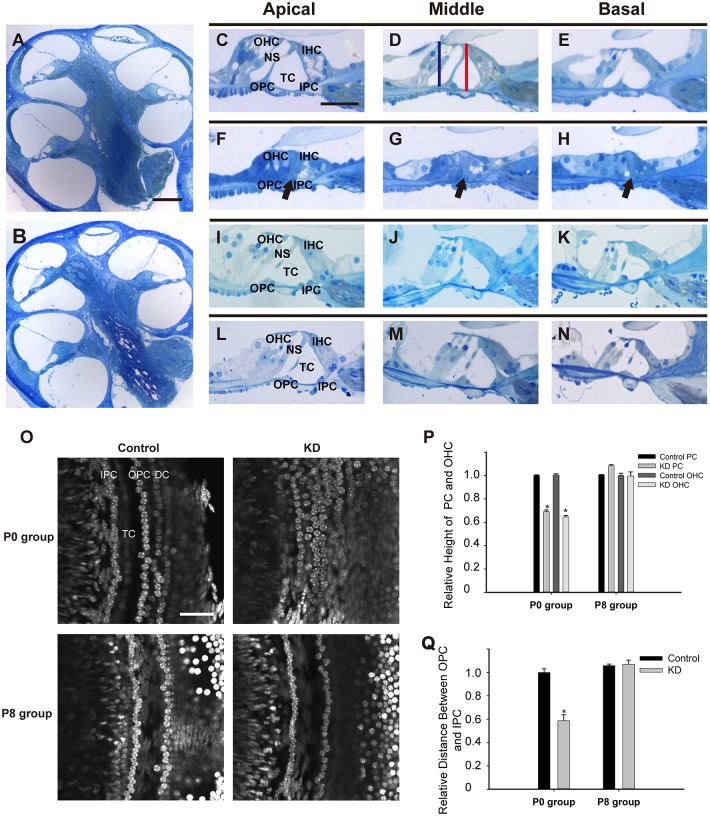
Developmental arrest of the OC occurred only when Cx26 was knocked down at the early postnatal stage. (A,B) A full view of the cochlear sections obtained from the P0 control (A) and P0 KD groups (B). (C-E) Morphology of the OC in the apical, middle and basal turns from the P0 control group. The red line in panel D indicates the distance from the head conjunction of the IPCs and OPCs to the basilar membrane, and the blue line shows the distance from the top of the third row of OHCs to the basilar membrane. (F-H) Morphology of the OC in different turns from the P0 KD group. The black arrows indicate the closed TCs in different turns. (I-K) Morphology of the OC in different turns from the P8 control group. (L-N) Morphology of the OC in different turns from the P8 KD group. (O) The stretched preparation at the supporting cell level shows the distance between the IPCs and OPCs in the control and experimental groups. (P) Relative heights of the PCs and the third row of OHCs in the control and experimental groups. (Q) Relative distances between the IPCs and OPCs in the control and experimental groups. *Significantly different from the control group (P<0.05). Scale bar: ∼200 µm (A); ∼40 µm (C,O).

