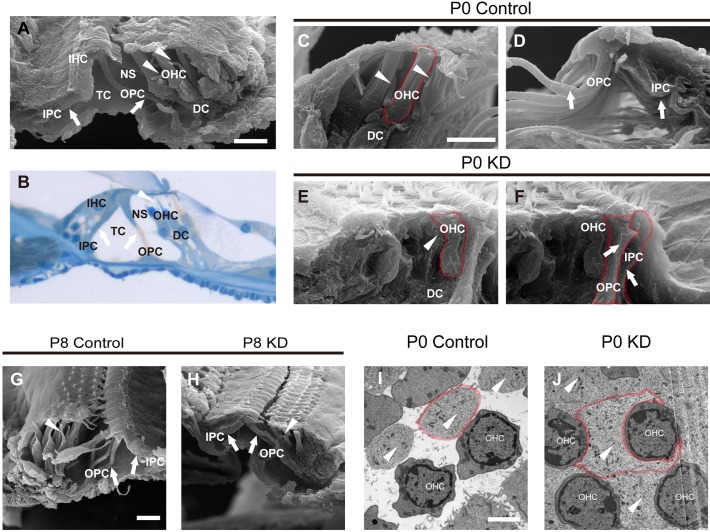
Fig. 4.
Spatial structures of the OC visualized by SEM in the P0 control, P0 KD, P8 control and P8 KD groups. (A) A full view of the OC was scanned by SEM from a control mouse at P30. The white arrows indicate PC bodies. The white arrowheads indicate the normal morphology of the phalangeal processes from the DCs. (B) A full view of an OC section from a control mouse at P30 stained with Toluidine Blue. The white arrows and the arrowhead indicate PC bodies and the phalangeal process of a DC, respectively. (C) Magnified image showing the thin and long phalangeal processes of DCs (white arrowheads) located between OHCs from the P0 control group, and NS was well formed between the OHCs and the phalangeal processes. The boundary of an OHC is shown by the red line. (D) The white arrows indicate mature OPCs and IPCs from the P0 control group, and the triangular TC is well formed. (E) The malformed phalangeal process of a DC (white arrowhead) in contact with an OHC. NS was not present in the P0 KD group. The boundary of an OHC is shown by the red line. (F) The OPC and IPC (white arrows) grew snugly together, and the TC never formed in the P0 KD group. The boundaries of an OPC and an IPC are shown by the red line. (G,H) The OCs from P8 control (G) and KD groups (H) were visualized by SEM, and the PCs (white arrows) and DCs (white arrowheads) were well developed in both groups. (I) A horizontal section from the P0 control group was captured at the OHC level by TEM, and the phalangeal processes of the DCs (white arrowheads) were not in contact with the OHCs. The boundary of one of the DC's phalangeal processes is shown by the red line. (J) The hypertrophic phalangeal processes of the DCs (white arrowheads) embraced the OHC bodies in the P0 KD group, and the boundary of one of the DC's phalangeal processes is shown by the red line. Scale bar: ∼30 µm (A,C,G); ∼5 µm (I).

