Fig. 6.
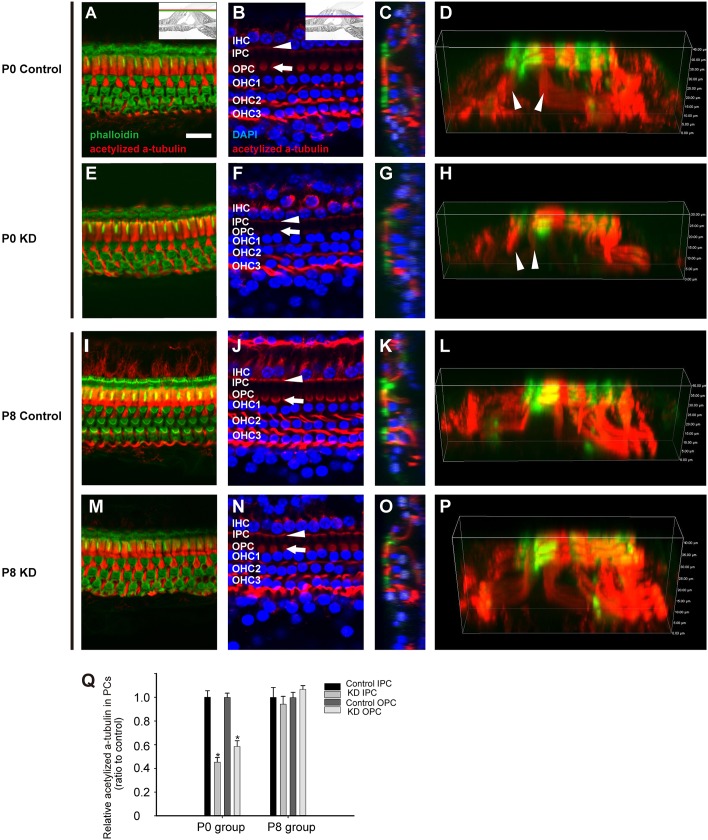
Cytoskeleton staining in the OC from the P0 control, P0 KD, P8 control and P8 KD groups. (A,E,I,M) F-actin (green) and acetylated α-tubulin (red) staining at the cuticular plate level in the P0 control, P0 KD, P8 control and P8 KD group, respectively. (B,F,J,N) F-actin (green) and acetylated α-tubulin (red) staining and the hair cell nuclei (blue) level in the P0 control, P0 KD, P8 control and P8 KD group, respectively. The positions of different cells are indicated. The white arrowheads point out the bodies of IPCs, and the white arrows point out the bodies of OPCs. (C,G,K,O) Cross-sections were generated to show the cytoskeletal patterns in the different groups. A triangular TC can be observed in the different groups, except for the P0 KD group in panel G. (D,H,L,P) The spatial arrangement of the cytoskeleton of the OC was reconstructed to show details in the different groups. (Q) Quantification of acetylated α-tubulin fluorescence in PCs at the level of the hair cell nuclei (n=3 in each group). *Significantly different from the control group (P<0.05). Scale bar: ∼30 µm (A).

