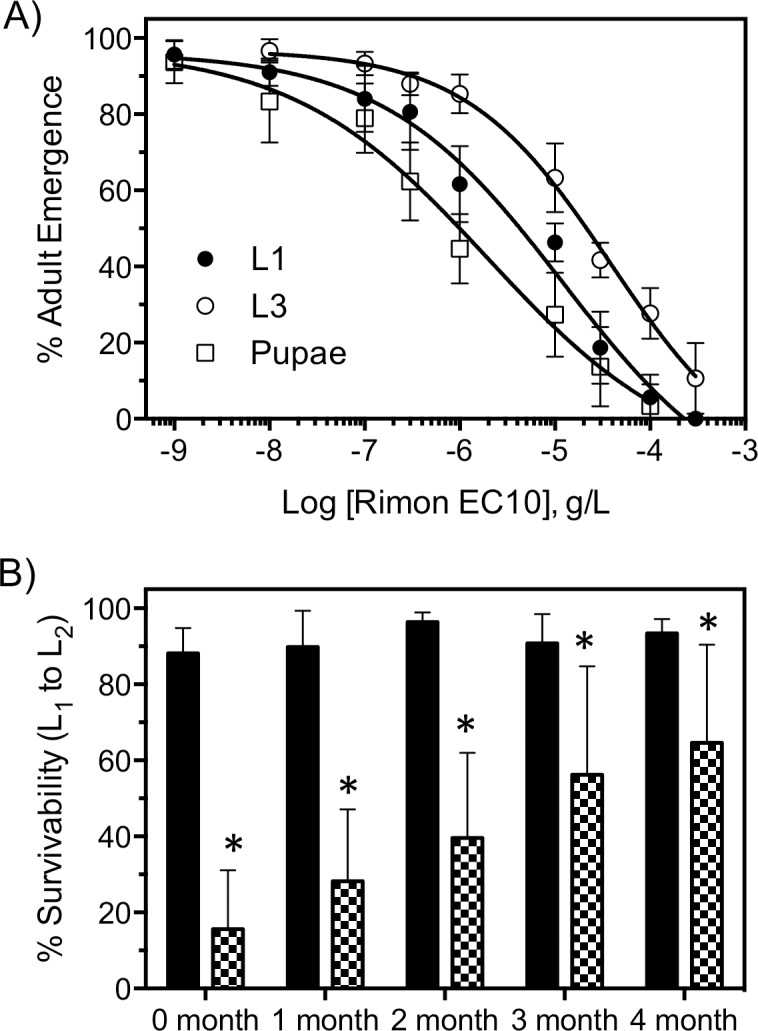
Fig 5. Larval toxicity and time course of horizontal transfer capabilities of Rimon EC10.

A) Concentration-response curves of Rimon EC10 when exposed to 1st-instars (closed circles), 3rd-instars (open circles), and pupae (open squares) as determined by inhibition of adult emergence. Each data point represents a mean % emergence derived from 3 replicates and each replicate consisted of 3 replicates of 20 larvae. Error bars represent SEM. B) % survivorship of larvae hatched into a habitat that was oviposited in by adults exposed to control (black bars) or Rimon EC10 treated netting (checkered bars) immediately after blood feeding. Mortality was measured by counting number of alive 1st-instar larvae compared to 2nd-instar larvae. Bars represent average survivorship (n = 25) and error bars represent SEM.
