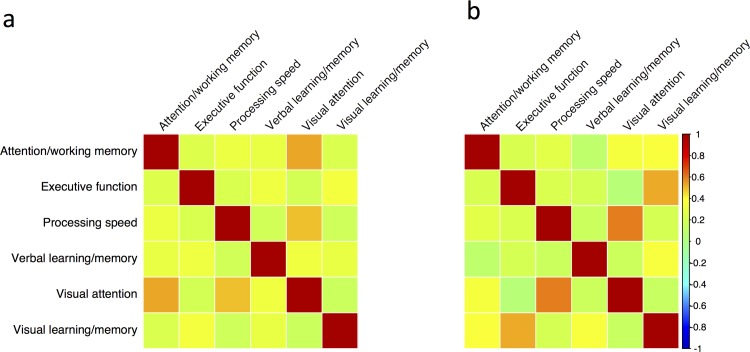
Fig 2. Comparison of the cognitive domain correlation matrices for the HIV-positive and HIV-negative control groups from the POPPY study.
Visualisation of the inter-domain correlation matrices for the HIV-negative (panel a) and HIV-positive (panel b) participants of the POPPY study. Colour scale determined by Pearson’s r (scale to the right of the figure).

