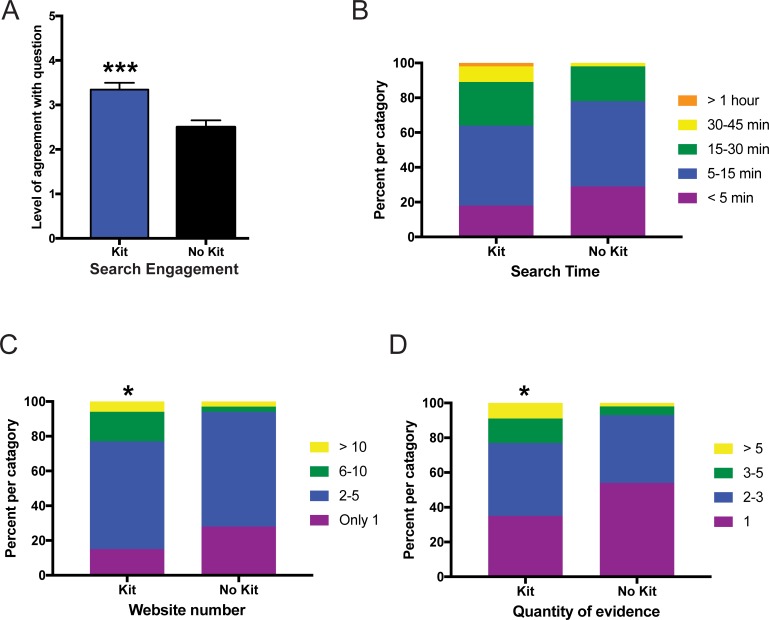
Fig 3. Online microbiome module assignment #2 comparing data to 14 subgroups with different dietary lifestyles.
Measurement of student responses regarding their agreement with questions about the online microbiome module assignment #2. Students who were given a kit evaluated their own microbiome data whereas those without a kit evaluated demo data. (A) Level of agreement for how engaged the students were during an internet search regarding diet and lifestyle and microbiome profiles. Statistical analysis for (A) performed using a Mann-Whitney U-test and all values are mean ± SEM with n = 65 for kit (blue) and n = 80 for no kit (black) (*** = p<0.001). (B) Self-reported time spent searching showed equivalent levels of time between groups whereas the students analyzing their own microbiome data had significantly higher number of website visits (C) and quantity of evidence collected (D). Statistical analysis for (B-D) were performed using a chi-square test and all values are shown as stacked bars (percentages of the categories chosen) with n = 65 for kit and n = 80 for no kit (* = p<0.05).

