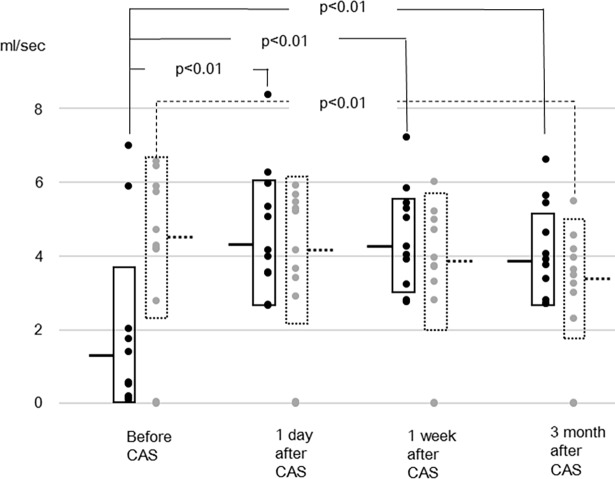
Fig 2. Flow rates of the stented internal carotid artery (solid line) and contralateral internal carotid artery (dotted line).
Horizontal bars and boxes represent mean and mean +/- standard deviation, respectively. Compared to preoperative values, the flow rates of the stented internal carotid artery after carotid artery stenting (CAS) are significantly larger. Compared to preoperative values, the flow rate of the contralateral carotid artery at 3 months after CAS is significantly smaller.

