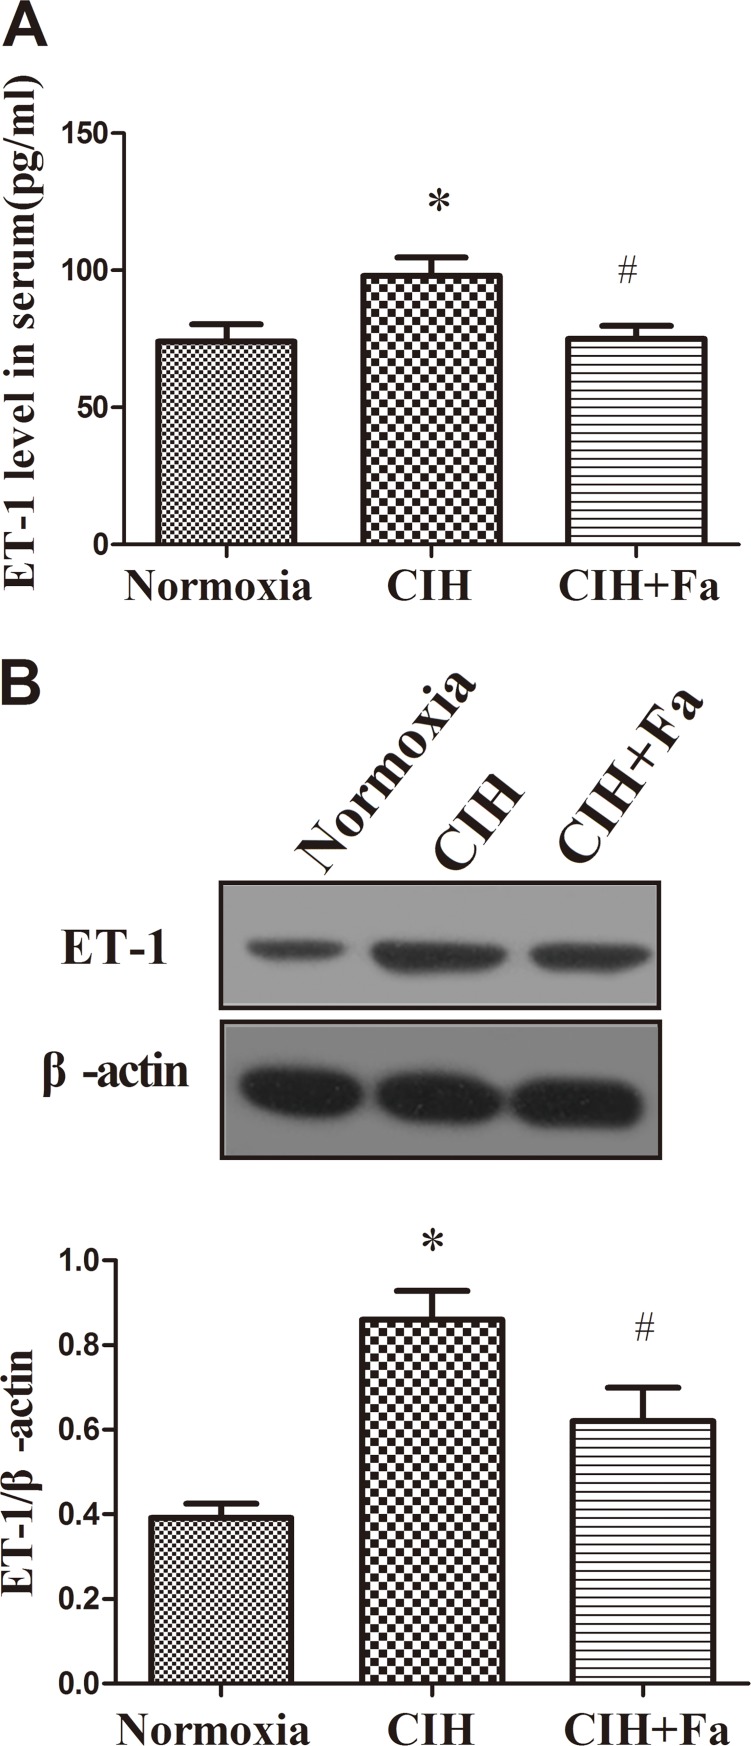
Fig 5. Levels ET-1 in the serum and aorta when subjected to CIH.
(A) ET-1 content was measured in serum from the Normoxia, CIH and CIH+Fa groups by radioimmunoassay. (B) ET-1 protein levels were measured in aortas isolated from the Normoxia, CIH and CIH + Fa groups by western blot. The results were expressed as the mean ± SE. *p < 0.05, CIH group vs Normoxia group; # p < 0.05, CIH + Fa group vs CIH group (n = 6 for each group).

