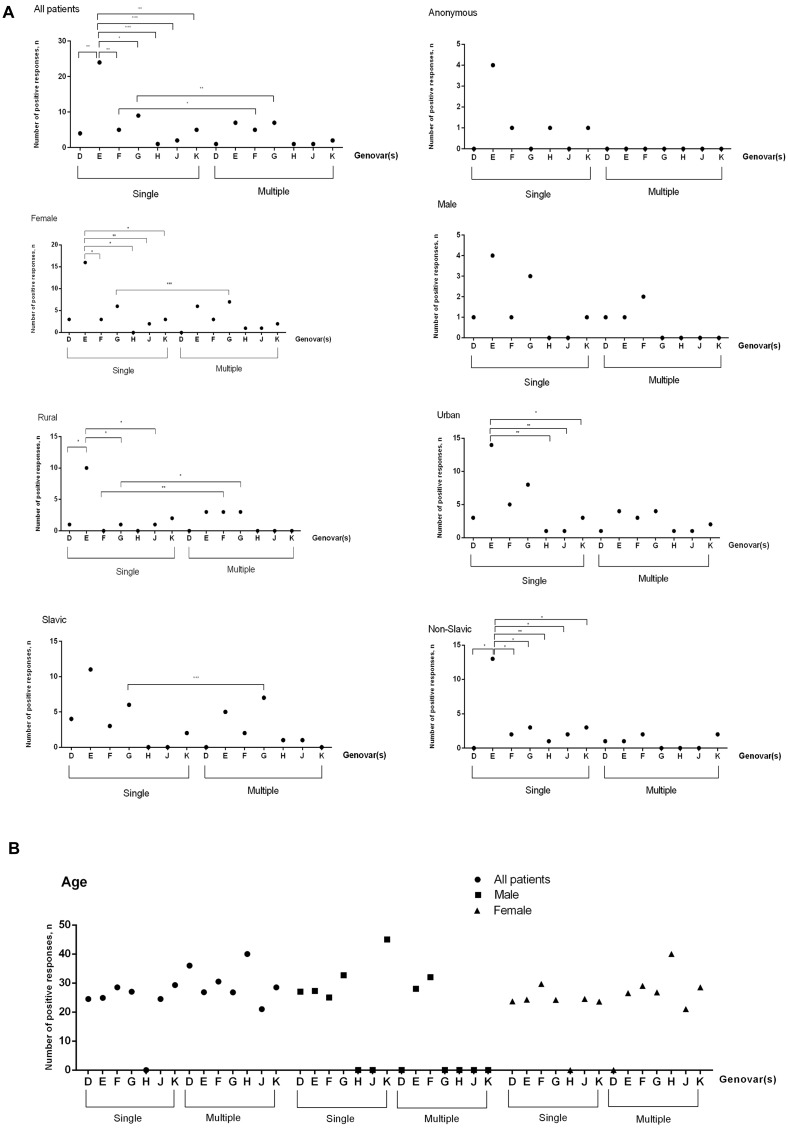
Fig 1. Distribution of genovars in CT-positive patients.
(A) According to their gender, place of residence and ethnic origin. (B) According to their age in mono-infected and multiple-infected CT-positive samples. Analysis was done by Fisher’s exact test (two-tailed). Statistically significant differences are indicated by * (p<0.05) or by ** (p<0.01) or by *** (p<0.001). Slavic cohort included Russians, Byelorussians and Ukrainians, Non-Slavic cohort was presented by Caucasians, Jews, Kyrgyzs, Koreans, Moldavians, Germans, Mordovians, and anonymous.

