Figure 3.
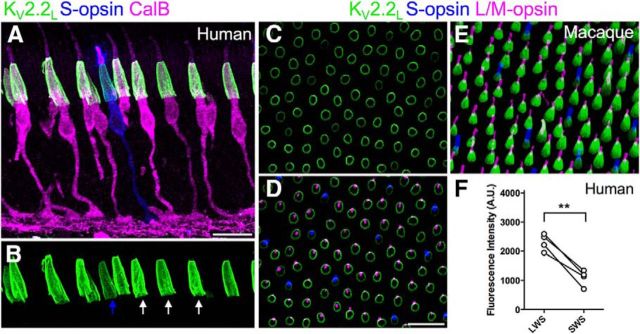
Primate S cones express lower levels of KV2.2 than L/M cones. A, Confocal projection of a vertical section of mid-peripheral human retina labeled for S-opsin, calbindin (CalB), and KV2.2L. B, Same section as in A showing region containing photoreceptor inner segments (green channel only). The 3 L/M cones (white arrows) and the one S cone (blue arrow) are projections through complete inner segments. C–E, Confocal images of a macaque retinal whole-mount labeled for Kv2.2, S-opsin, and L/M-opsin. C, Focus is at the inner segments. D, Same x-y-z position in green projected onto z planes from the photoreceptor outer segments to enable identification of cone spectral type. E, Side projection of a different region of the same retina. The smaller and less intense KV2.2 staining is associated with the S cone inner segments. F, Relative fluorescence intensity of KV2.2 immunostaining in L/M cones (LWS) versus S cones (SWS) in human retina. Lines connect measurements taken in the same retinas. **p = 0.0029. Scale bar, 20 μm.

