Figure 8.

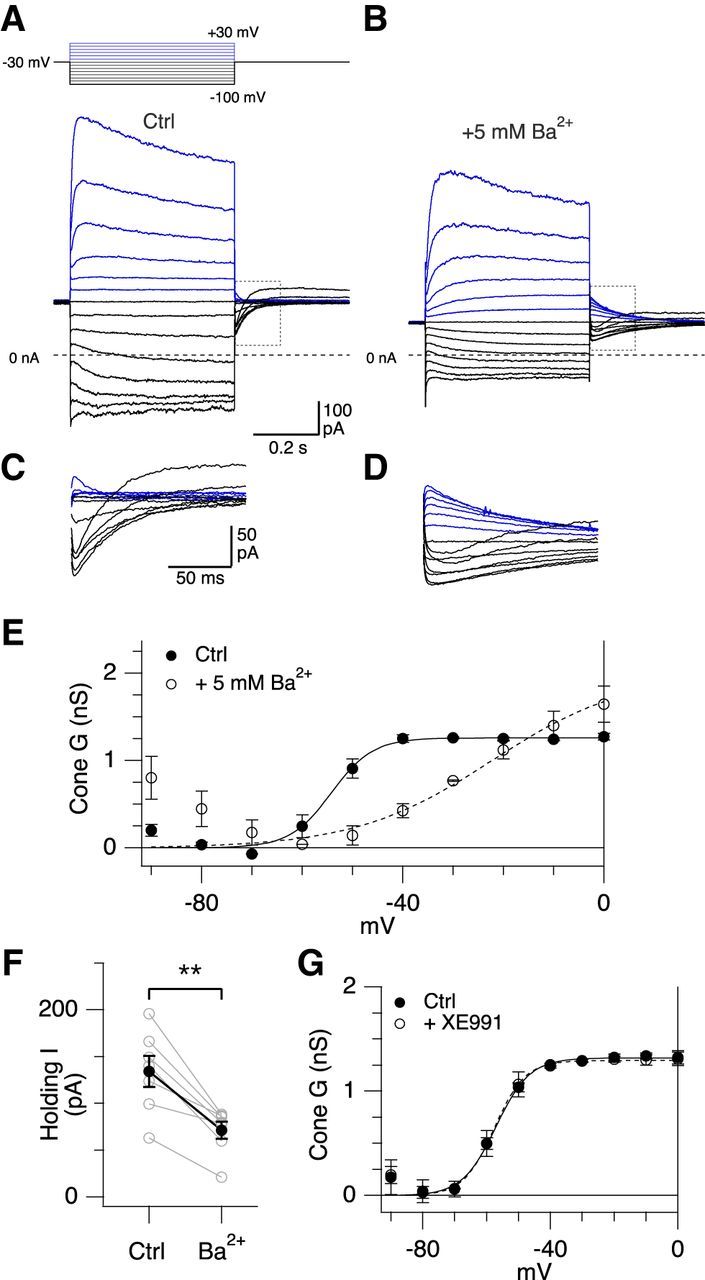
Barium shifts the activation of the low-voltage–activated KV currents in cones. A–D, Average voltage-activated currents from macaque cones that were recorded before (A) and after (B) application of 5 mm Ba2+. Control traces represent a subset of cells shown in Fig. 7 A. Voltage step protocol is shown above traces. Tail currents are highlighted by the gray bounding box and shown on an expanded scale in C, D. The tail currents evoked from steps to −90 and −100 mV show an outward current that may be due to relief of inactivation of an A-type KV current. E, Cone conductance before (solid circles, n = 5) and after application of 5 mm Ba2+ (open circles, n = 5) (mean ± SEM) shown as a function of voltage. Solid and dashed lines indicate Boltzmann fits. F, Holding current (at −30 mV) before and after application of 5 mm Ba2+. Solid symbols represent mean ± SEM. Gray symbols represent individual cells. **t(6) = 5.46, p = 0.0016, paired t test. G, Cone conductance before (solid circles) and after application of 25 μm XE991 (open circles) (mean ± SEM, n = 3) shown as a function of voltage.
