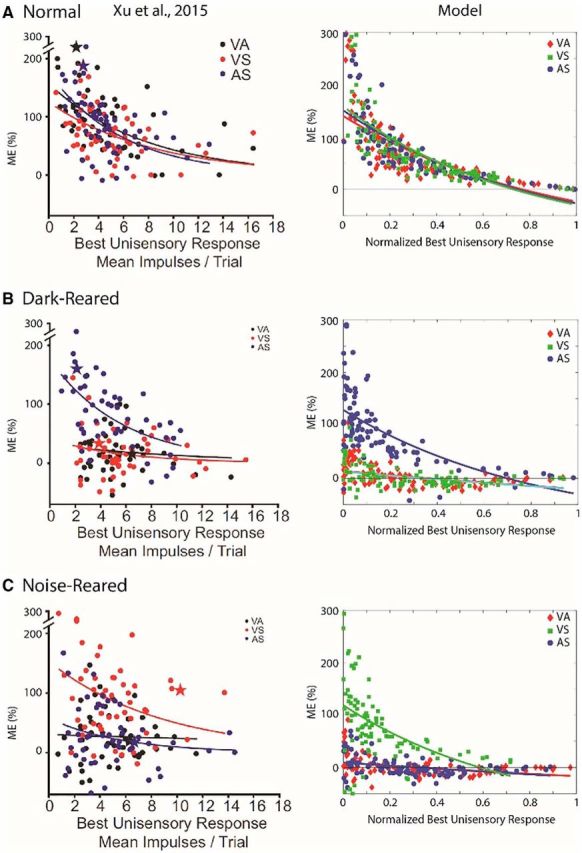
Figure 5.

Empirical model parallels in ME and inverse effectiveness. Plotted are individual data points and trend lines relating proportionate ME (%) to the magnitude of the response to the most effective component stimulus (i.e., unisensory response) for the normal-reared (top), dark-reared (middle), and noise-reared (bottom) populations. The left panel for each population shows the empirical result from Figure 3 of Xu et al. (2015). The right plot shows the model results (each data point was derived from the mean responses of each model's unit computed over 30 trials/stimulus condition). In each case, modality pairings that were present in the rearing environment/training paradigm showed an inverse relationship between ME and the magnitude of the best unisensory response, a trend termed inverse effectiveness (Meredith and Stein, 1983). Pairings that were excluded from the rearing environment/training paradigm showed marginal, nonsignificant trends and no significant enhancement on average anywhere in the range. All fitted curves are exponential. (Insets adapted with permission from Xu et al., 2015).
