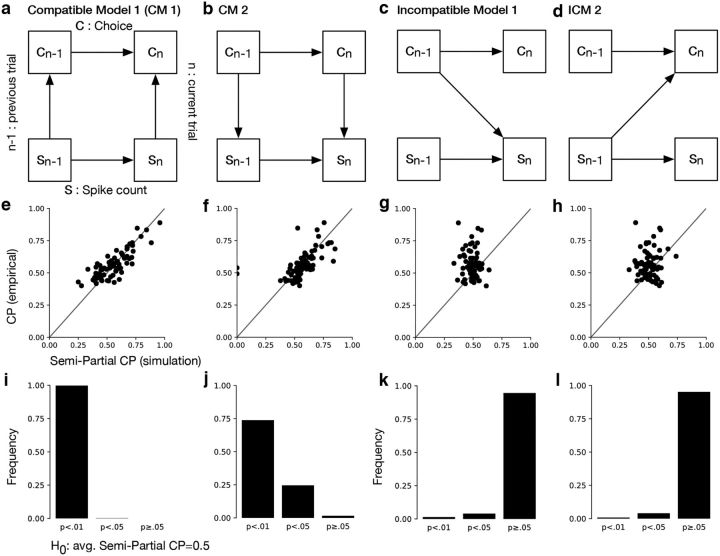
Figure 8.
Sensitivity of semipartial correlation analysis in simulated data. a–d, CM 1 and CM 2 are two models that are compatible with our results, whereas ICM 1 and ICM 2 are incompatible with our conclusion. We fit these models to statistics of our dataset and for each unit repeatedly simulated as many trials as no-signal trials were recorded for this unit (9522 trials across all units). e–h, Semipartial CPs are plotted against empirical CPs but for simulated data (see Materials and Methods) for a single repetition. The data points are scattered along the identity line for the compatible models, similar to the empirical results (compare Fig. 7b). In contrast, semipartial CPs are reduced to ∼0.5 on average for incompatible models. i–l, For each of 500 repetitions, we performed one-sample t tests with the null hypothesis (H0) that the mean semipartial CP is equal to 0.5. For nearly all of the simulations the null hypothesis is rejected for the compatible models (i, j). As expected, we observe the opposite for incompatible models (k, l).

