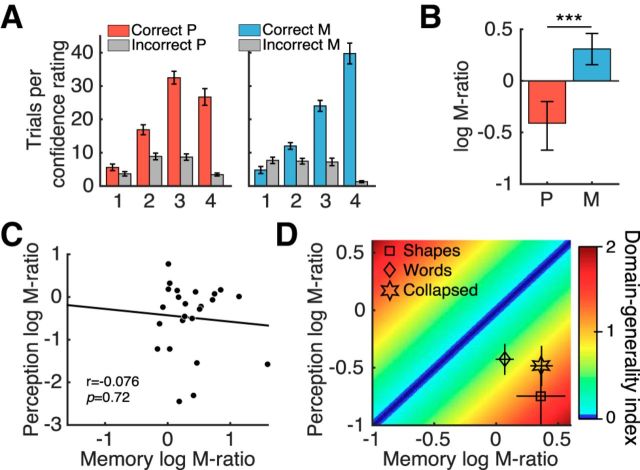
Figure 2.
Metacognitive measures. A, Mean number of correct and incorrect trials per confidence rating. B, Metacognitive efficiency measured by log(meta-d'/d'). Zero indicates that metacognitive sensitivity (meta-d') is equal to task sensitivity d' (i.e., the d' that would have been predicted to give rise to the observed confidence rating data assuming a signal detection theoretic ideal observer). Group-level hierarchical Bayesian estimates differed significantly between domains. Error bars indicate 95% HDI from posterior samples. C, Metacognitive efficiency scores obtained from single-subject Bayesian model fits were not correlated across perceptual and memory domains. D, DGI for each subject that quantifies the similarity between their metacognitive efficiency scores in each domain (see main text for details). Greater DGI scores indicate less metacognitive consistency across domains. Mean log(meta-d'/d') values for each stimulus type in both domains are shown for reference. Bars in A and D indicate SEM. ***pθ>0 ∼ 1. P, Perception; M, memory.

