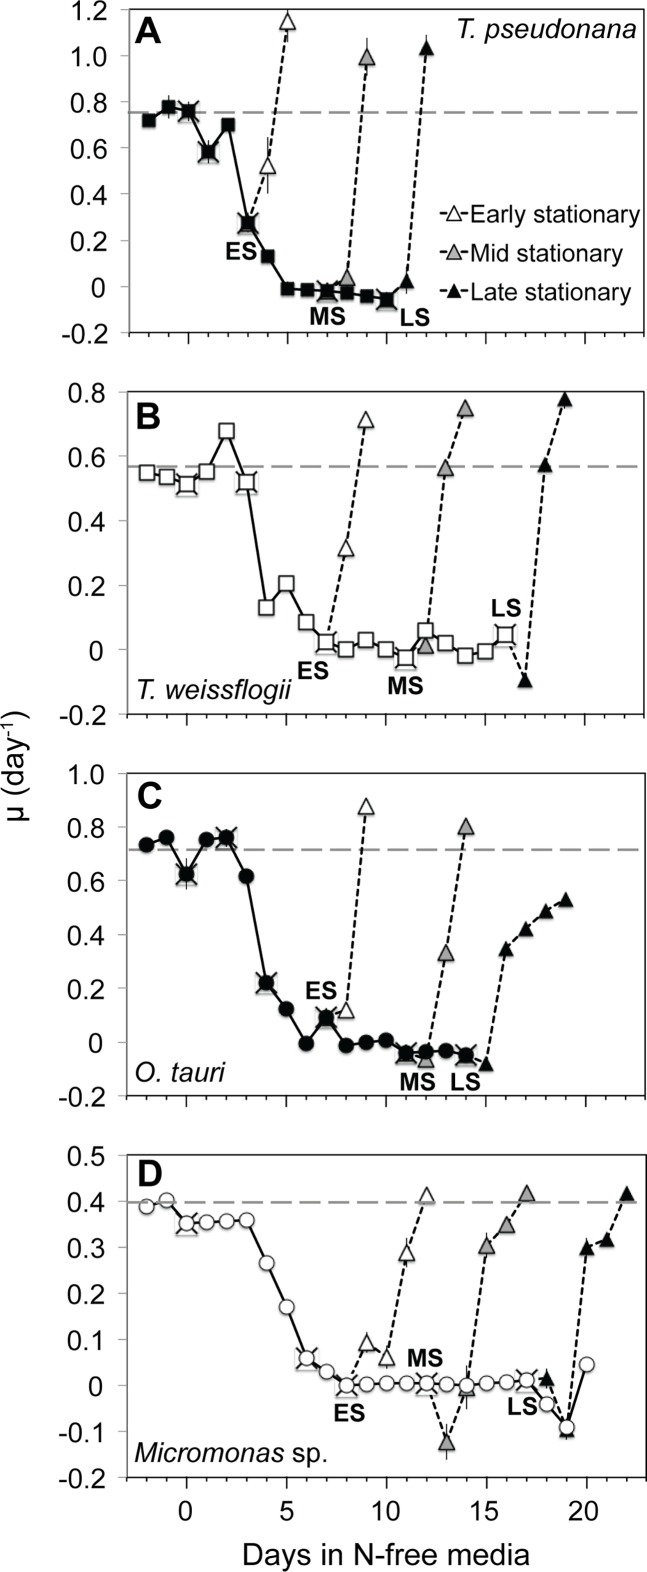
Fig 1.
Growth rate (μ) from N-replete balanced growth to N starvation and in N-starved sub-cultures following the addition of nitrate in (A) T. pseudonana, (B) T. weissflogii, (C) O. tauri, and (D) Micromonas sp. (X) symbols indicate sampling points for cell composition and photochemistry. Recovery after the resupply of N is shown for subcultures collected at early (ES, white triangles), mid (MS, gray triangles), and late stationary (LS, black triangles) phases. The dashed line indicates the μmax for a species determined during N-replete, balanced growth. Error bars indicate one standard deviation among triplicate cultures.

