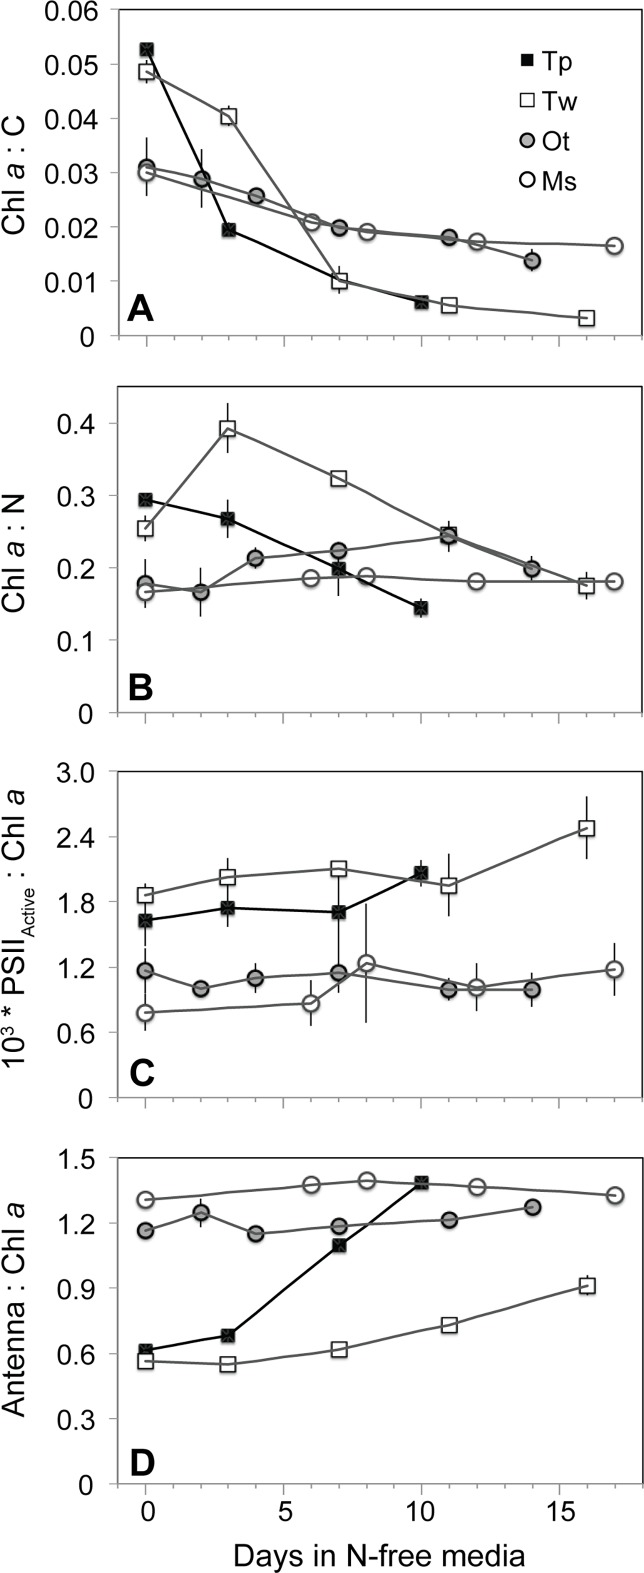
Fig 4.
The change from N-replete growth to N starvation in molar ratios of (A) chl a content to cellular carbon, (B) chl a content to cellular nitrogen, (C) the cellular content of active PSII reaction centers to chl a, and (D) pigment content associated with light harvesting antenna complexes to chl a. Error bars indicate one standard deviation among triplicate cultures.

