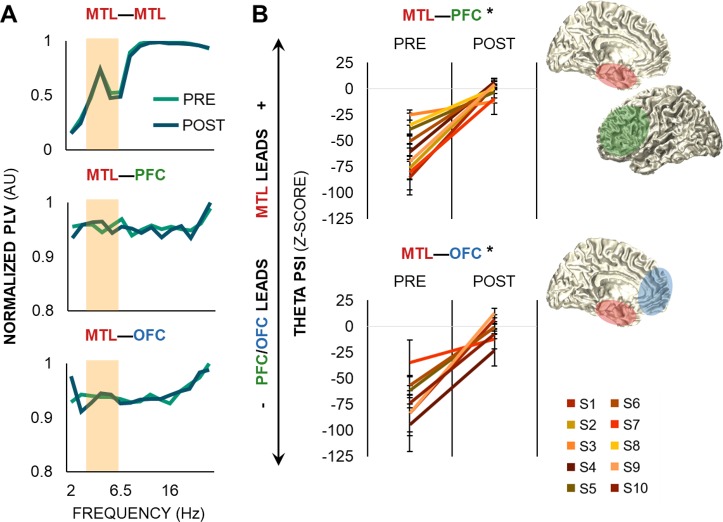
Fig 3. Theta oscillations link frontotemporal regions during working memory.
(A) PLVs over pre- and postcue delays within all MTL electrodes (top) and between all MTL and PFC (middle) and OFC (bottom) electrodes in a representative S. Theta and alpha peaks were observed within the MTL and between MTL and frontal regions over delay. Data are represented as the temporal mean of each delay interval, normalized by the maximum PLV across all electrodes. The shaded area indicates the theta range used for PSI analysis, as depicted in panel B. (B) Theta band PSI shifted from a unidirectional, frontal-driven network during the precue delay to a bidirectional, MTL-frontal network during the postcue delay (p < 4 × 10⁻²⁷). Data are represented as mean ± SEM per S; positive values indicate that the MTL leads the PFC (top) or OFC (bottom), and negative values indicate that the PFC/OFC leads the MTL. * = significant effect. Underlying data can be found in University of California, Berkeley, Collaborative Research in Computational Neuroscience database (http://dx.doi.org/10.6080/K0VX0DQD). MTL, medial temporal lobe; OFC, orbitofrontal cortex; PFC, prefrontal cortex; PLV, phase-locking value; POST, postcue delay; PRE, precue delay; PSI, Phase Slope Index; S, subject.

