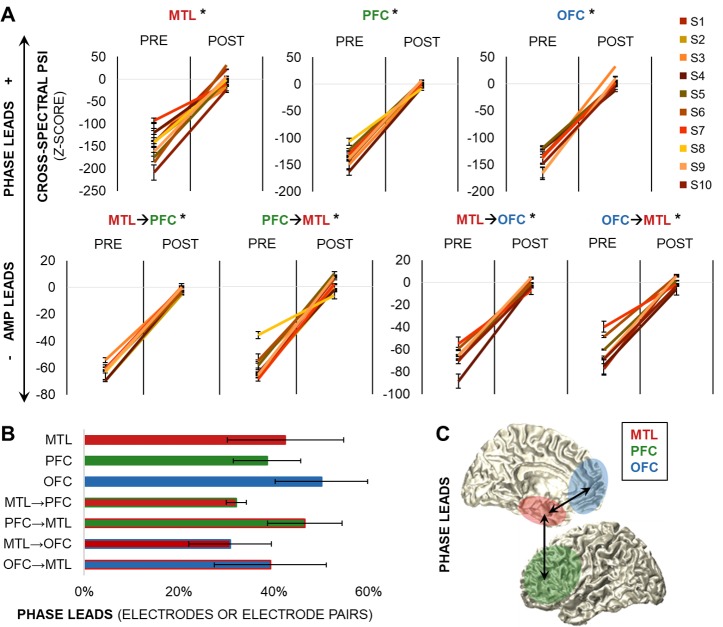
Fig 4. Theta oscillations direct cross-spectral activity during information processing.
(A) Theta phase–amplitude directionality shifted from pre- to postcue delay both locally and across regions (p < 7 × 10⁻²⁶). Data are represented as mean ± SEM per S; positive values indicate that phase leads amplitude, and negative values indicate that amplitude leads phase. * = significant effect. (B) Percentage of individual electrodes and electrode pairs in which theta phase directed higher-frequency amplitudes during the postcue delay. Data are represented as mean ± SEM. (C) Schematic of theta phase–led bidirectional frontotemporal interactions during the postcue delay. Underlying data can be found in University of California, Berkeley, Collaborative Research in Computational Neuroscience database (http://dx.doi.org/10.6080/K0VX0DQD). AMP, amplitude; MTL, medial temporal lobe; OFC, orbitofrontal cortex; PFC, prefrontal cortex; POST, postcue delay; PRE, precue delay; S, subject.

