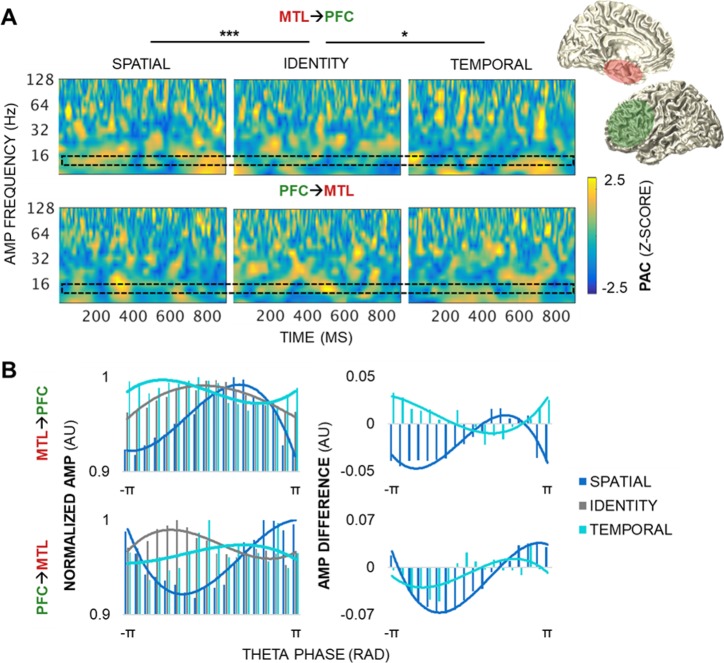
Fig 6. MTL→PFC theta PAC dynamics track both space and time.
(A) PAC by condition during the postcue delay in a representative MTL–PFC electrode pair. MTL→PFC (top) and PFC→MTL (bottom) pairs showed variable, transient PAC across the spectrum of amplitudes (z > 1.96, p < 0.05). MTL→PFC PAC was greater for spatial than identity information, with peak differences at 13.5- to 16-Hz amplitudes during the 100- to 250- and 800- to 900-ms epochs (p < 2 × 10⁻⁴). MTL→PFC PAC was also greater for temporal than identity information (p < 9 × 10⁻⁵). No condition differences were observed in the PFC→MTL direction. The black block indicates the amplitude data range depicted in panel B. * = significant condition effect; *** = significant condition, condition × frequency, condition × time, and 3-way interaction effects. (B) The distribution of raw higher-frequency amplitudes across 18 theta phase bins, by condition, normalized by the maximum amplitude across all of the phase bins. Underlying data can be found in University of California, Berkeley, Collaborative Research in Computational Neuroscience database (http://dx.doi.org/10.6080/K0VX0DQD). AMP frequency range: beta (centered at 13.5 Hz). AMP, amplitude; MTL, medial temporal lobe; PAC, phase-amplitude coupling; PFC, prefrontal cortex; RAD, radians.

