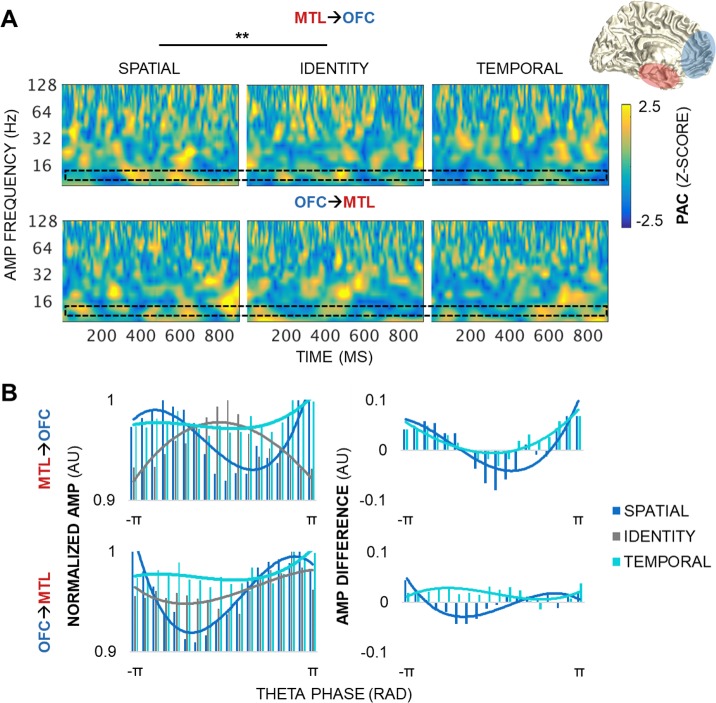
Fig 7. MTL→OFC theta PAC dynamics track space but not time.
(A) PAC by condition during the postcue delay in a representative MTL–OFC electrode pair. MTL→OFC (top) and OFC→MTL (bottom) pairs showed variable, transient PAC across the spectrum of amplitudes (z > 1.96, p < 0.05). MTL→OFC PAC was greater for spatial than identity information, with peak differences at 9.5-Hz amplitudes (p < 5 × 10⁻³). No condition differences were observed in the OFC→MTL direction. The black block indicates the amplitude data range depicted in panel B. ** = significant condition and condition × frequency effects. (B) The distribution of raw higher-frequency amplitudes across 18 theta phase bins, by condition, normalized by the maximum amplitude across all of the phase bins. AMP frequency range: alpha (centered at 9.5 Hz). Underlying data can be found in University of California, Berkeley, Collaborative Research in Computational Neuroscience database (http://dx.doi.org/10.6080/K0VX0DQD). AMP, amplitude; MTL, medial temporal lobe; OFC, orbitofrontal cortex; PAC, phase-amplitude coupling; RAD, radians.

