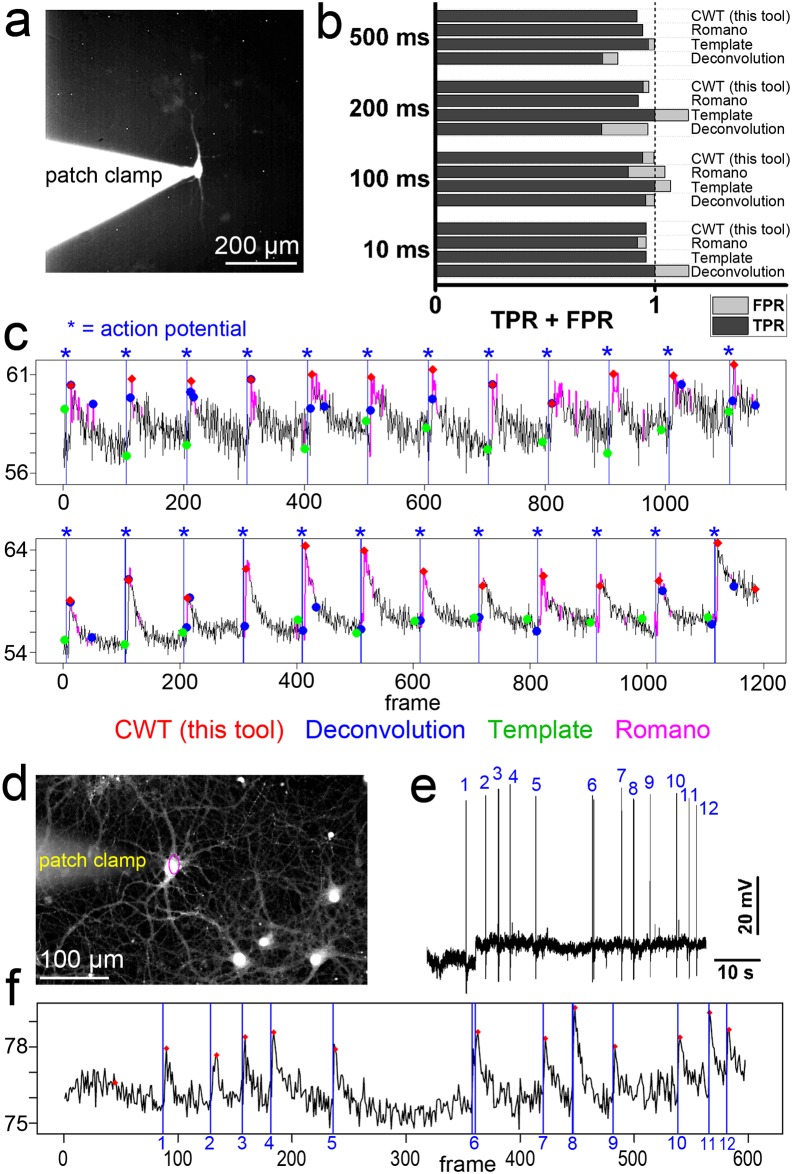
Fig 3. Computation of action potential-induced calcium events.
a, Experimental approach. Whole-cell patch clamp recording and parallel calcium imaging of single cells. Here, the calcium indicator was applied with the help of the patch clamp pipette. b,c, Analysis of true-positive responses (TPR) and false-positive responses (FPR) based on parallel calcium imaging and patch clamp recording. Action potentials were induced by current injection (12 times, 200 pA, interstimulus interval: 5 s) for different times (10–500 ms). Current injection of 200 pA for 10 ms (upper panel in c) or 100 ms (lower panel in c) induced single action potentials (indicated by the blue label and vertical line. Calcium imaging was performed at 20 Hz. Calcium event labeling by four computational approaches. Four computational strategies for calcium event definition were applied; our CWT-approach, deconvolution, template-matching, and definition of significant signals above a computed baseline (‘Romano toolbox’). d, Experimental approach. Hippocampal neurons were cultured for 24 days in vitro. At this age, neurons develop glutamatergic synapses with mature hallmarks [39] and become spontaneously active. Cells were loaded with OGB1-AM and investigated with patch clamp recording and calcium imaging at 20 Hz. e, f, Electrophysiological recording of action potentials induced by spontaneous activity. In this trace, twelve action potentials are marked and correlate with AP-induced calcium spikes. All twelve calcium events (ROI, cell soma in a) were labeled by the CWT computation under these low SNR conditions.

