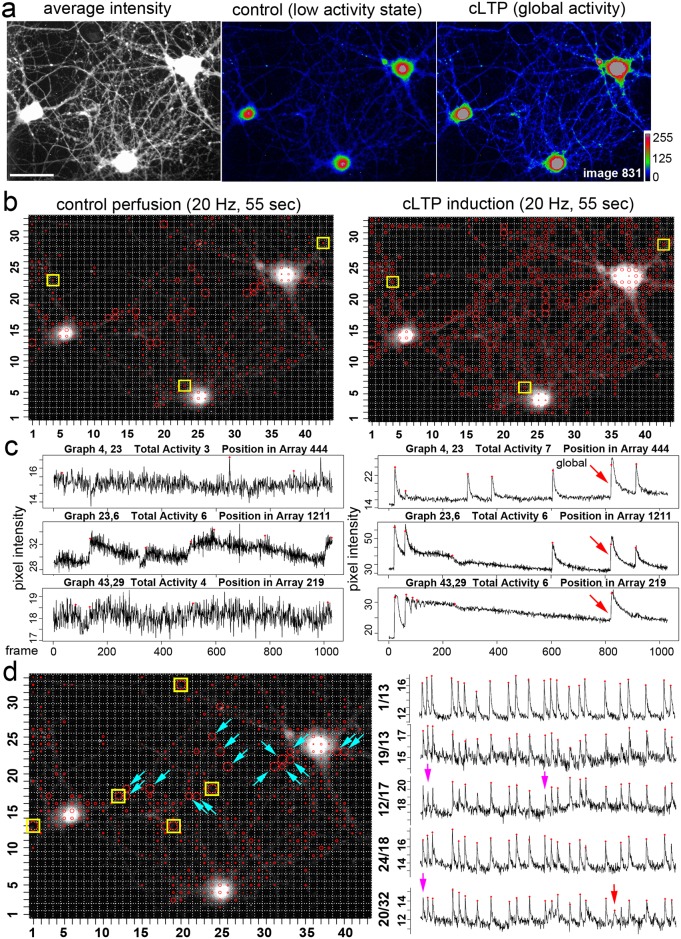
Fig 5. Activity profile of cultured hippocampal neurons before and after activity induction.
a, Average intensity: Hippocampal neurons loaded with a fluorescent calcium indicator. Control; neurons at a low activity state. cLTP; neurons in a global activity state after treatment with a chemical LTP induction solution. b, Activity distribution under control conditions. Calcium imaging was performed for 55 seconds with a speed of 20 Hz. Virtual total activity number (WS8, SNR 2.5, SAT 11, MAC 2): 2135 activity events. Note that regions of high activity are indicated by circles with a larger diameter (Fig 5d). Under cLTP treatment, neurons increase their total activity number to 4785 events. Yellow marks point to grid windows shown in c. c, Under control conditions, activity events close to the baseline trace are found at some positions. After cLTP treatment local and global calcium signals (global: red arrow) are detected. Calcium spikes and local calcium transients are marked. d, Calcium spikes in loci of synchronous activity. (left) Spontaneous activity profile of hippocampal neurons under control conditions. Neuronal somata do not exhibit a spiking behavior. Calcium spikes are identified in the periphery in indicated grid windows. Yellow squares point to grid windows, which are shown on the right with the corresponding signal trace and the activity marks. Blue arrows point to other grid windows with this synchronous activity pattern. Out-of-synchronicity events are also detected (Red arrow on the right). Some obvious calcium spikes were overseen by the computation due to the stringency parameters used for this analysis (purple arrows). In Fig 6e we show that the spikes are detected when the same data are analyzed at SNR values of 2.0 and 1.5.

